每日观察:关注App Store和Google Play发展情况(2.21)
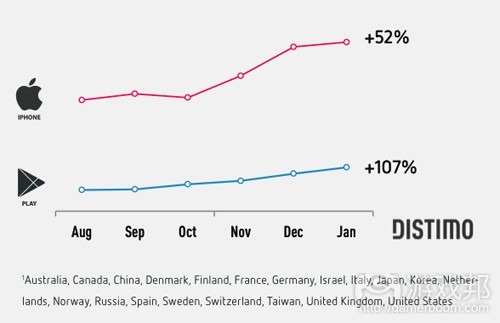
1)应用追踪公司Distimo日前发布报告分析了苹果App Store和Google Play两个平台的发展情况,指出Google Play自2012年8月以来发展最为显著,在20个最大的市场日常收益增长了107%。
在过去6个月中,苹果iPhone及iPad App Store略逊于Google Play,但日常收益也增长了52%。Google Play今年1月份的日常收益增长17%,App Store增长3%,这两个应用商店的应用总数已达150万。
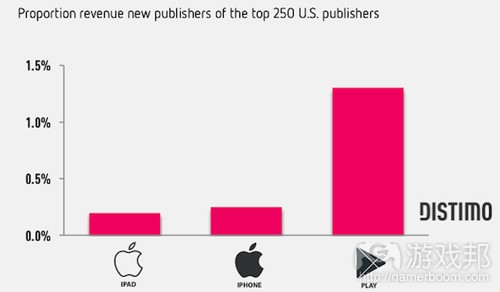
从2012年10月至2013年1月,美国iPhone App Store前250名发行商中,仅有2%属于新晋发行商,而美国Google Play的新发行商比例则是3%。这些新晋发行商在Google Play总收益中占比1.2%,而苹果App Store新晋发行商收益仅占比0.25%。
Google Play新晋发行商推出的应用数量甚于苹果App Store的同行,平均每家发行6款免费应用,而iPhone App Store新晋发行商平均发布2款免费应用。
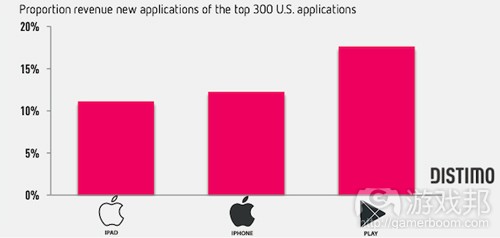
美国iPhone App Store前300款热门应用中,有17%属于新产品,而Google Play新应用的这一比例则是12%(游戏邦注:Distimo在此将过去4个月上线的应用归为新产品),但Google Play新应用所创造的收益超过了苹果App Store新应用。在美国Google Play中,新应用在该平台总收益中占比18%;iPhone App Store新应用的收益比例则是12%。
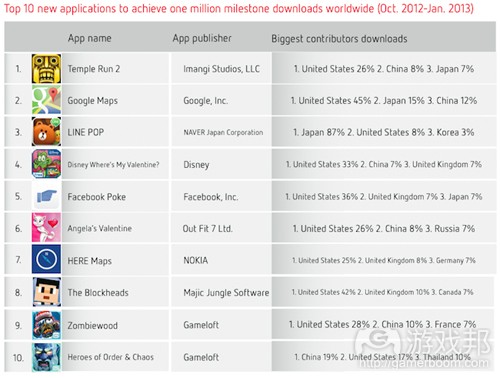
美国App Store下载量最高的新应用当属《Temple Run 2》、Google Maps以及NHN Japan所推出的益智游戏《Line Pop》。这三者上线24小时的全球下载量均超过100万次。《Temple Run 2》发布4天在所有平台下载量达2000万次,上线两周下载量达5000万次。美国是App Store前10款热门应用下载量最高的市场。
Distimo还指出,从2012年10月至2013年1月,《愤怒的小鸟:星球大战》、《侠盗猎车手:罪恶都市》、《Temple Run 2》这三款顶级新应用上线一周在全球收益分别达到100万美元。在前10名热门新应用中,有8者采用付费模式(其中有4款含有IAP功能),另外两款则采用免费增值模式。
2)Juniper最新针对手机及平板电脑游戏市场的报告预测,由于平板设备兴起,IAP模式的普及,到2016年平板电脑游戏玩家在IAP及虚拟货币中的投入将超过30亿美元。
报告还指出,免费博彩游戏已开始通过IAP渠道增加收益,例如《Slotomania》、《Zynga Poker》、《德州扑克》的付费用户数量明显增长,甚至出现了单笔交易就消费100美元的情况。
Juniper的报告还发现,多数平板电脑游戏IAP收益将来自远东、中国和北美地区,这三个地区的这一收益在2016年将占比超过86%。
智能手机仍将是用户IAP消费的主要平台,预计到2016年这一平台的IAP交易额将超过60亿美元,比平板电脑平台多2倍以上。
3)SuperData Research最新报告指出,2013年1月全美数字游戏市场规模达9.6亿美元,比去年12月增长39%(游戏邦注:这里包括PC平台可下载内容、主机、移动、免费MMO、订阅模式和社交网络等游戏类型)。
1月份社交游戏增幅同比上年仅增长2.1%;去年顶级社交游戏的用户规模为5000-6000万左右,但今年的这一用户规模仅为4000-5000万,下降20%。
免费MMO游戏的用户数量在1月份从原先的4410万降至4140万,付费MMO游戏收益则同比上月增长至8600万美元,低于去年时的1.34亿美元。
得益于节日优惠活动,移动游戏的用户付费转化率达到5.16%。
在美国排名前三甲的游戏中,纸牌游戏占据两个席位,King.com游戏《Candy Crush Saga》是收益最高的移动游戏,位居其后的分别是《Marvel:War of Heroes》以及《Rage of Bahamut》。
该时期美国可下载PC内容以及主机游戏收益达4.11亿美元(去年为2.3亿美元)。
4)Strategy Analytics最近报告指出,苹果iPhone 5和iPhone 4S是2012年第四季度最热销智能手机。
该季度iPhone 5销量为2740万部,iPhone 4S则是1740万部,三星S III则是1540万部,iPhone 5和iPhone 4S在该季度全球智能手机出货量中占比约20%。
iPhone 5已在全球智能手机出货量中占比13%,成为史上最热销智能手机。而2012年第三季度最热销手机则是三星S III(1800万部),iPhone 5在同一时间的销量仅为600万部(当时iPhone 5上市时间较短),iPhone 4S则是1620万部。
5)分析公司Forrester最近预测,2017年西欧平板电脑用户将增长四倍,其网络成人用户比例将从去年的14%增长至2017年时的55%。在2011年,平板电脑用户比例仅为7%。
预计2017年西欧平板电脑用户安装量将超过1.47亿,超过2012年时的3300万。
Forrester的调查样本是1.3万名法国、德国、意大利、荷兰、西班牙、瑞典和英国用户,其中2012年平板电脑用户比例最高的是荷兰(20%),西班牙则是18%,意大利为16%,英国为15%,法国仅为9%。
用户最常使用平板电脑上网、查收邮件、登陆社交网络、玩游戏和浏览图片。有63%受访者表示会与配偶共用平板电脑,有三分之一与子女共用平板电脑。
苹果iPad是西欧最受欢迎的平板电脑,并且在iPhone用户中极具人气,有83%的欧洲iPhone用户拥有一部iPad;与之相似,三星Galaxy平板电脑在三星Galaxy和Wave智能手机群体中的普及率也相对较高;Windows 7平板电脑用户也多持有Windows智能手机。
这一地区的平板电脑用户平均拥有6台其他连网设备,“其中科技达人的比例也高于非平板电脑用户”;在欧洲智能手机用户中,拥有平板电脑的用户比例达28%,而非智能手机用户的这一比例则是12%。(本文为游戏邦/gamerboom.com编译,拒绝任何不保留版权的转载,如需转载请联系:游戏邦)
1)Distimo: 2% of top iPhone publishers are new, 3% on Google Play
Scott Reyburn
App tracking company Distimo today released its latest report, dissecting the state of new publishers and apps in the Apple App Store and Google Play.Distimo logo
Before analyzing new publishers and apps, Distimo took a look at the growth of the two app stores. Google Play showed the most growth since August 2012, increasing daily revenues by 107 percent across the 20 biggest countries. In the past six months, the Apple App Store for iPhone and iPad showed less growth compared to Google Play, but daily revenues still grew by 52 percent. Last month, Google Play’s daily revenues increased 17 percent, while the Apple App Store increased by 3 percent. Note that the absolute values on the Apple App Store were already much higher than Google Play’s. Lastly, there’s a combined 1.5 million apps on the Apple App Store and Google PlayDistimo report February 2013 chart 1
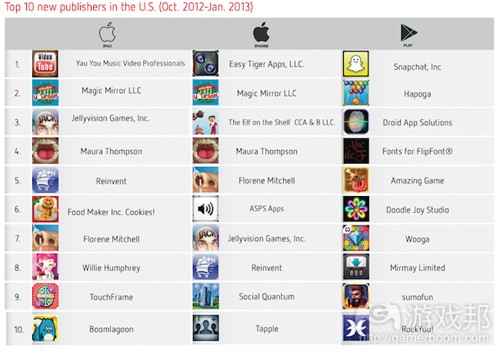
The Dutch firm first analyzed the top 250 publishers within the last four months from October 2012 to January 2013 in the U.S., finding that only 2 percent of the top 250 publishers are new on the U.S. Apple App Store for iPhone compared to 3 percent for Google Play in the U.S. Revenue-wise, the new publishers in Google Play accounted for 1.2 percent of total revenue, which includes in-app purchases, for the app store, while new publishers in the Apple App store for iPhone accounted for .25 percent. Some of the top new publishers included Magic Mirror, developer of the ElfYourself by Office Max app on iPhone and iPad, and the makers Snapchat on Android. Among the newcomers in both app stores, Google Play had more new publishers launching apps versus the Apple App Store, with an average of six free apps, while new publishers in the Apple App Store for iPhone published an average of two free apps.
Now when Distimo took an in-depth look into new apps, 17 percent of the top 300 apps in the U.S. Apple App Store for iPhone were new apps, while 12 percent of the apps were new on Google Play in the U.S. The company classified a new app in this report as an app from a publisher that was first seen within the last four months — from October 2012 to January 2013. Despite a larger percentage of new apps among the top 300 apps on the Apple App Store when compared to Google Play, new apps in Google Play gained more revenue than new apps in the Apple App Store.
On Google Play in the U.S., 18 percent of total revenue, including in-app purchases, came from new apps, on the flip side, 12 percent of total revenue was generated by new apps in the U.S.
Distimo then looked at the velocity of the new apps in terms of how fast the apps were downloaded and made money. The most downloaded new apps on the Apple App Store worldwide were Temple Run 2, Google Maps and NHN Japan’s puzzler Line Pop. In 24 hours after the app released, all three apps garnered more than one million downloads worldwide. Temple Run 2 from Imangi Studios in particular, raked in 20 million downloads across all platforms in four days and 50 million in two weeks. The U.S. was the country that drove the most downloads to the top 10 new apps.
Distimo also revealed the top new apps to generate $1 million in revenue worldwide from October 2012 to January 2013. The top three apps to do so were Angry Birds Star Wars (HD version as well), Grand Theft Auto: Vice City and Temple Run 2. Each of these apps pulled in $1 million worldwide, one week after release. For the business model of these apps, eight of the 10 apps were paid apps, of which four had in-app purchases. The other two apps were based on the freemium model.(source:insidemobileapps)
2)Over $3bn to be spent on IAPs in 2016 by tablet gamers
by Daniel Gumble
New research highlights the rapid uptake for tablets as a gaming platform.
A new study by Juniper into the mobile and tablet games market has found that the increasing uptake for tablet devices, along with the growing acceptance of IAPs (in-app purchases) could see tablet gamers spend over $3 billion on IAPs and virtual currencies by 2016.
Looking at the impact of mobile games on the video games industry at large, the reports identifies a clear migration of those using dedicated portable gaming devices across to tablets and, to a lesser extent, smartphones. One of the key reasons for this appears to be the freemium model, which is far more difficult to implement on dedicated gaming devices on account of the games having to be purchased upfront, as well as the devices often not allowing 3G or 4G connections.
Meanwhile, developers are increasingly monetising their handset or tablet games using virtual currencies. This has been proved to increase users’ engagement with the game, as it can only be spent within that particular game.
Report author Siân Rowlands noted: “when we consider that only a small amount of gamers actually make in-game purchases, and those that do typically only spend a few dollars, it becomes apparent that there are a small proportion of consumers spending thousands annually on these virtual currencies, who subsidise the game for everyone else.”
The report also showed how free-to-play casino style games were beginning to yield increased profits from IAPs, even though users are not playing for real money stakes. Such games as Slotomania, Poker by Zynga and Texas Poker have seen a sharp increase in the number of users purchasing chips and other in-game items. In some cases spending up to $100 in one transaction.
Juniper’s findings also show that the majority of in-game purchase revenue on tablets will be made in the Far East and China and North America, which will account for over 86 per cent of users’ spend in 2016.
Elsewhere, smartphones will remain the primary device from which users make in-app purchases, with more than $6 billion predicted to spent on them in 2016 – over double the amount spent on tablets.(source:mobile-ent)
3)Total U.S. game market grew 39 percent in January if you count all segments
Dean Takahashi (Staff)
The overall digital games market grew 39 percent compared to the same month last year and totaled $960 million. Month-over-month, January earnings are roughly equal to December 2012, according to a report by SuperData Research.
By comparison, a report from NPD Group said that U.S. retail games industry sales were up just 9 percent. But SuperData said it captures all of gaming’s segments, including downloadable content on PC and console, mobile, free-to-play massively multiplayer online games, subscription, and social-network games.
Social games grew just 2.1 percent in January, compared to a year ago. Where last year a top social title could get 50 million to 60 million users, today the top range is around 40 million to 50 million users, down about 20 percent, according to SuperData Research chief executive Joost Van Dreunen.
Free-to-play MMO games saw some shrinkage, with the number of players declining in January to 41.4 million from 44.1 million. Paid MMOs saw revenues increase month-over-month to $86 million, but that is down from $134 million a year ago.
Mobile games got a boost from holiday specials and discounts, cultivating a continued appetite among consumers. The category showed an increase in conversion rate, reaching 5.16 percent across all game genres in terms of the percentage of players who pay for items in free-to-play games.
For the U.S., two of the top three games were card titles, and King.com’s Candy Crush Saga emerged as the top-grossing mobile title, followed by Marvel: War of Heroes and Rage of Bahamut.
Downloadable PC and console games reached $411 million, up from $230 million the year before. Namco Bandai’s Ni No Kuni: Wrath of the White Witch (pictured at top) rose to the top three and displaced Assassin’s Creed III. That helped the downloadable-content market grow.
SuperData wants to provide more transparency for digital games with a high-level overview of the monthly U.S. games market.(source:venturebeat)
4)Galaxy who? iPhone 5 & 4S were the two best-selling smartphones in Q4 2012
Sean Ludwig
Apple might have some problems keeping investors interested, but consumers are clearly still Apple-hungry. The iPhone 5 and iPhone 4S were the two best-selling smartphones in the fourth quarter of 2012, according to a new Strategy Analytics report.
Strategy Analytics’ data showed the iPhone 5 was the overall champ, with 27.4 million iPhone 5 units sold in the fourth quarter, while 17.4 million 4S units were sold, and 15.4 million Galaxy S III units were sold. The iPhone 5 and 4S combined accounted for 1 in 5 of smartphones shipped in the world in Q4 2012.
“The iPhone 5 captured an impressive 13 percent share of all smartphones shipped globally, and it has become the world’s bestselling smartphone model for the first time ever,” Strategy Analytics wrote in its report. “A rich touchscreen design, extensive distribution across dozens of countries, and generous operator subsidies have been among the main causes of the iPhone 5’s success.”
In the third quarter of 2012, by comparison, the Galaxy S III was on top with 18 million units sold, the iPhone 5 (which was barely available in Q3) sold 6 million units, and the iPhone 4S had 16.2 million units sold.
While this news is good for Apple, Samsung can’t be counted out looking forward. Samsung is rumored to be releasing its Galaxy S IV — the successor to the Galaxy S III — some time in March. If that timing holds true and the phone is more powerful and flashy than the S III, the S IV could easily overtake the iPhone 5′s sales in the second quarter of 2013.(source:venturebeat)
5)Forrester: Tablet Ownership In Europe To Rise 4x In 5 Years — 55% Of Region’s Online Adults Will Own One By 2017, Up From 14% In 2012
Natasha Lomas
Forrester is predicting tablet ownership in Western Europe will quadruple by 2017 – with the percentage of online adults owning a slate projected to increase markedly from less than a fifth (14 per cent) last year to more than half (55 per cent) in 2017. In 2011 the tablet-owner figure stood at just 7 per cent, underlining how quickly digitally connected consumers are adopting slates. ”With double-digit growth in tablet uptake across Western Europe in 2012 and further double-digit growth expected, tablets can no longer be considered a fad,” says Forrester, writing in a new tablet-related research report it’s putting out tomorrow.
The analyst said it expects the consumer-owned installed base of tablets to reach more than 147 million in Western Europe in 2017, up from 33 million in 2012. Its tablet growth forecast is based on a survey of 13,000 consumers in France, Germany, Italy, Netherlands, Spain, Sweden, and the UK. The polled nations with the largest proportion of tablet owners, as a percentage of their total online population, were the Netherlands, with 20 per cent tablet penetration in 2012; Spain with 18 per cent; Italy with 16 per cent; and the U.K. with 15 per cent. France was lowest with just nine per cent.
In a preliminary version of Forrester’s tablet report, seen by TechCrunch, a few observations stand out — including a downward shift in the age-range of the largest group of tablet owners, shifting away from 30- to 40-year-olds to 18- to 24-year-olds. The analyst found a quarter of online adults in the 18- to 24-year-old category owned a tablet in 2012. The shift towards more younger tablet owners may accelerate in future — Forrester points to the rise of “competitively priced” Android powered tablets in the sub-€250 category, such as Amazon’s Kindle Fire and Google’s Nexus 7. And since tablet ownership increases with income, according to Forrester’s findings, and the young are keenest on owning a tablet, then cheaper Android tablets which are half the price of Apple’s iPad are likely to be helping to drive adoption lower down the age range, to users who previously may not have had the disposable income to afford an iPad. As well as Android-powered slates stepping into that pricing vs demand gap, Apple also came out with the smaller, cheaper iPad mini last year. Yet more fuel for the tablet fire.
The living room and the bedroom are the only locations where tablet owners chose their slate over their smartphoneWhile the young are the keenest on tablets, Forrester said they are by no means the only age-group with an interest. Nearly one in six European online consumers aged 65 or older already owns a tablet, according to the report.
Despite the rise of cheaper slates, price remains a considerable barrier to tablet entry for a big chunk of online European adults — Forrester found that around a third of those polled are not planning on buying a tablet due to price (and regardless of income) — suggesting lots of potential tablet owners still have trouble justifying the purchase of an additional gadget, on top of their smartphone or PC.
When it comes to tablet usage, Forrest found that tablets are unsurprisingly most used in the home — specifically the living room, bedroom and kitchen, whereas smartphones have a much wider and more consistent distribution of usage (as illustrated by the graphic below). The living room and the bedroom are the only two locations where polled tablet owners chose their slate over their smartphone. Or, in other words, the most used gadget is the gadget you have in your pocket.
According to Forrester, the main usage activities for tablets are accessing the Internet, emailing, social networking, playing games, and viewing pictures. It also found that tablets are not the highly personal devices that smartphones are: of the tablet-owners who have a spouse/partner, 63 per cent said they share their tablet with them, while one-third share it with their children — making tablets “a far more social device than smartphones”, according to the analyst.
“Tablets are social devices mostly used in the digital home,” said Thomas Husson, analyst and co-author of the new report, in a statement. “Companies that want to exploit tablet opportunities need to understand they require a differentiated approach from smartphones.”
The report also underlines a ‘halo effect’ for smartphone makers who also sell tablets. Forrester identified a general allegiance among smartphone owners to their phone’s brand when choosing a tablet — especially pronounced for iPhone owners but not limited to Apple’s hardware. The report notes:
While the Apple iPad is the dominant tablet in Western Europe, it is most popular with iPhone owners — a staggering 83% of European iPhone owners who have a tablet opted for an iPad. Similarly, the Samsung Galaxy tablet is most popular with Samsung Galaxy and Wave smartphone owners, and the Windows 7 tablet with owners of Windows-based smartphones.
Tablet owners also tend to own a plethora of other connected gadgets — six others on average, according to Forrester — and are “more technology savvy than non-tablet owners”, a finding that is consistent with an early adopter profile. Forrester links smartphone ownership to tablet ownership as a key driver for slate sales up to now — noting that “the proportion of European smartphone owners who own a tablet (28 per cent) is more than double that of those who aren’t smartphone owners (12 per cent)”.
However the analyst says what’s true for the current crop of (still early adopter) tablet owners, won’t be true as tablet ownership expands to take in a greater proportion of the population. ”We are still in the early-adoption phase of tablet ownership, so the next wave of tablet owners will not be as eager; to convince them to adopt a tablet, marketers will need to stress attributes like accessibility, ease of use, and relevance,” says Forrester.
The analyst believes tablets are likely to expand their usefulness beyond the living room/bedroom in the near future, with usage patterns being shaken up by a variety of factors including enterprise/workplace adoption of tablets; the diversification of form factors (such as smaller tablets and phablets, touchscreen laptops and “netvertibles”, hybrid devices and other new forms); as well as the roll out of 4G cellular services and more cellular data bundles.
Likewise, tablet usage will be dictated by form factor — so usage patterns may also shift, as tablets migrant to other locations. “A tablet with an attachable keyboard will encourage greater usage of email and work-related applications; and while not a pocket-size device, a 7-inch tablet will encourage greater portability,” the report notes.(source:techcrunch)









 闽公网安备35020302001549号