Adparlor总裁通过3大指标详细分析Facebook广告市场
此前的文章已经全面讨论了影响顾客购买价格的一些因素,以及关于随着时间增长顾客在购买行为上花费会持续增加的有趣问题。而在这篇文章中,探讨的则是4个主要使用英语的国家——美国、英国、加拿大以及澳大利亚中游戏用户的购买力如何。这次分析将通过调查3个关键指标——用户人数、广告竞争和用户质量来确定这4个国家的“市场吸引力”。
用户数量
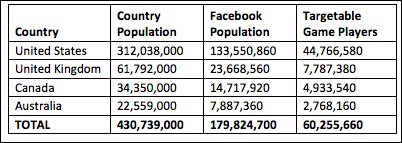
从下面的表格可以得知,美国不论在人口总数还是Facebook用户人数上都领先于其他3个国家,这也解释了为什么在目标玩家群的数量上美国也处于领先地位。事实上,美国在这4个国家的总共6000万名目标用户中占了74%的份额,拥有近4500万的目标玩家群。(所谓的目标玩家群指的是喜欢某特定游戏的玩家,广告商可以针对他们的喜好来投放广告。)游戏邦了解到,许多游戏应用的开发者在发行游戏时都主要瞄准美国这个拥有大量用户群的市场。
当然,用户群基础并不是唯一重要的。在使用英语的4巨头国家之外,还有许多的国家拥有重要的Facebook用户群,并且有着庞大的玩家团体。而且还需要了解这些国家的用户群在竞争力上如何影响广告的投放,以及相对的他们的真正价值有多大。
广告竞争度
对于任意一个国家来说,Facebook广告的竞争格局总在不停的变化。有成千上万的小型广告商在不断地改变他们的广告投放方向,因为他们需要根据那些拥有大量预算的玩家的具体情况,不定时的更改促销战略。不过可以确定的是总体来说Facebook广告市场的竞争激烈程度呈不断上升趋势,而广告点击收费(CPC)要价也在增加。可以看到有效创意/抄袭和细化目标群的做法,还将使“插件安装收费模式”的要价和一年之前一样具有竞争力。
成功的游戏开发商会深挖更细致的层级,针对目标玩家群详细分析竞争态势,甚至还会更加深入,去分析每个特定游戏类型的玩家群竞争态势。如果你在为一款城市建造类的游戏做广告,而其他大型的广告商也同时为相同的宣传内容出价,那么这将必然增加这些广告之间的竞争,而CPC的要价也会水涨船高,最终让顾客购买价格上升。
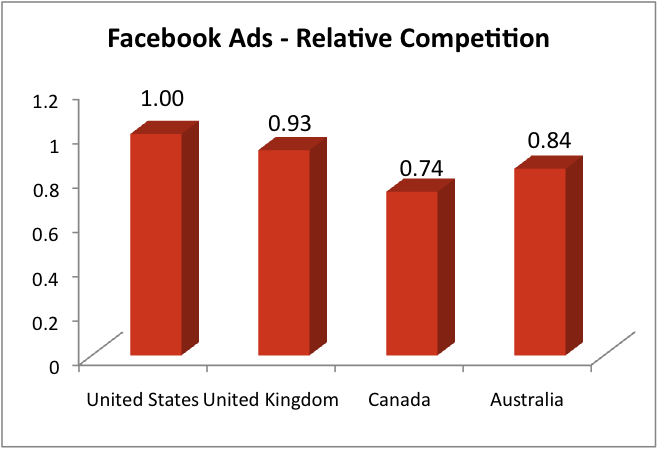
由于游戏广告市场在不断变化,很难预测你的行动能比刚开始时增加多少竞争力。不过在细致的层面,还是可以做出一些分析。我们可以看到,在单一国家内,竞争态势在短时间里将相对保持在一个水平,但在诸如圣诞节这样的节日中例外。因此,通过追踪广告服务公司AdParlor在过去几个月内做出的销售中的几个关键点的“插件安装收费模式”(CPI)要价,可以得出4个投放Facebook广告的主要国家的大致竞争态势。下面的图表将美国Facebook市场的竞争力作为标准值1.00,以便看出美国和其他3个英语国家间的不同Facebook广告竞争态势。可以看到美国的Facebook广告市场竞争最为激烈,而加拿大的Facebook广告竞争程度是最低的。接下来将透过分析用户质量来解释为何广告竞争程度如此重要。
用户质量
用户质量部分是整篇分析中最为重要的。不论用户总数和竞争态势如何,用户的质量才是决定开发者要在哪个国家投放广告的终极因素。虽然这个因素很难被测量,但通过AdParlor在各游戏公司当中发起的数百个深度调查活动,可以得到了3个最重要的指标,并创造了Retention、Engagement、Monetization (REM) 3个数值来体现各国的用户质量。需要说明的是,这些数值根据每个游戏的不同特点可能发生巨大的变化,支付方式的数量和种类也会对REM的数值产生很大的影响。
可以看到总体趋势如下:女性群体有着比男性群体更好的用户质量;年龄较大的群体拥有比年轻群体更好的用户质量;硬核玩家有着比休闲玩家更好的用户质量。不过在特定国家的特定游戏群体中,某些游戏类型也会比其他游戏类型更受到欢迎,为了保护平台用户的商业机密,这里不公布分析的细节而只公布合计的结果,来显示这4个英语国家用户质量的比较情况。
结论
在分析了用户数量、广告竞争和用户质量之后,让我们回到关于市场吸引力的讨论。上面的图表表明,澳大利亚拥有比美国质量更高的用户,而广告竞争度却低于美国,这清楚说明澳大利亚是一个非常适合进行广告促销的市场。但你会因此把自己在美国的投资转入澳大利亚吗?
如果你理解用户数量,广告竞争度和用户质量三者的关系,那么你就不该这么做。你会发现虽然一开始澳大利亚的用户会给你很高的投资回收率和广告点击收费率,但这个市场内有限的游戏玩家数量将很快让你陷入难题。摆在眼前的事实是,在美国有着相当于澳大利亚15倍的目标用户群。除非澳大利亚的用户群能提供更好的竞争力,否则广告点击收费率将随着时间的推移而减少。对于大型活动来说,美国市场将能很快的赶上澳大利亚市场的投资回收率,因为在美国就是能够有更多的用户购买零售价更低的产品。
虽然这份对于4个主要英语国家的分析很有趣,但由于市场的开发性以及高素质的游戏开发者带来的“公平性”,很难从这些数据中得到太多的竞争优势。不过,欧洲、南亚和其他地区Facebook平台的失败更值得研究,因为这些地区具备巨大的用户群体,很低的广告竞争度以及很高的REM用户分值。记住本文中分析的3个指标很重要,它们可以帮助你看清哪个国家最具备游戏市场潜力,以及你该在哪个国家花费广告投资。(本文为游戏邦/gamerboom.com编译,转载请注明来源:游戏邦)
Facebook Ads – Analyzing English-Speaking User Acquisition for Game Developers
In previous articles, we have discussed the factors that affect user acquisition pricing overall and the interesting sub-topic around the rising cost of user acquisition over time. In this guest post, we will examine user acquisition in the “big four” English speaking countries – United States, United Kingdom, Canada, and Australia. Most Facebook games launch in English and many of them remain exclusively in English. So the goal of this analysis is to determine the ‘market attractiveness’ of these four countries by looking at three key indicators – available volume, advertiser competition, and user quality.
Available Volume
Looking at the table below, we can see that the United States makes up a large portion of the overall population and the Facebook population relative to the other three. This also translates when we compare the number of targetable game players in these countries. In fact, out of approximately 60 million targetable game players across these four countries, the United States encompasses 74% or almost 45 million of these users. (Note that targetable game players is different from total game players as Facebook ads allows you to target users who “like” the game – and not all of the games users.)
Many application developers, upon launching their game, focus strictly on the United States given the large user base available.
However, it is of course not just the user base that matters. Outside of the big four – there are many countries that have a significant Facebook population and consequently a large game player community. We also need to take a look at how competitive it is in advertising to these users versus how valuable they really are.
Advertiser Competition
For any particular country, the competitive landscape around Facebook ads is always changing. Tens of thousands of small advertisers constantly modify their ad spend – while the power players with large budgets strategically ramp up and slow down their marketing efforts at often unpredictable times. While the general consensus is that competition is increasing overall across Facebook Ads and that CPC bids are rising, we see that effective creative/copy along with efficient micro-targeting can still result in cost-per-install pricing being just as competitive as it was over a year ago.
Successful game developers will dig deep at the micro level and examine the competition specifically for targetable game players – and even deeper to determine the competition for players of their particular game genre. Trying to advertise a city-building game when other large advertisers are bidding on those same keywords will significantly increase the competition for those impressions, increasing CPC prices, and hence the cost of user acquisition.
Given that the market for game specific advertising is always changing, it is difficult to predict how much competition you will run up against when starting your campaign. However, some analysis can be done at the macro-level. We see that competition within a country remains relatively consistent over short time periods – with the exception of holidays like Christmas. Hence, by following CPI prices at several points over the past few months from the millions of acquisitions delivered for Adparlor’s gaming clients, we have been able to come up with a relative competition scale for all four countries on Facebook. The graph to the right has been normalized to give the US a relative competition score of 1.00 so we focus on the difference between the United States and other English speaking countries. We can see from the graph above that the US is in fact the most competitive and Canada is the least competitive. The section below on user quality points to why this is the case.
User Quality
Now we come to the most important part of the analysis – user quality. Regardless of the volume available and the competition – the quality of the users is paramount in deciding which countries to advertise in. While this is normally difficult to measure, AdParlor has run hundreds of campaigns for game companies and we often measure deep metrics. We have combined the three most important metrics and devised a Retention, Engagement, Monetization (REM) score for these countries by giving a certain weight to each component – i.e. monetization has more weight than the other two metrics. It is important to note that these scores can vary widely per game based on many factors. The number and types of payment providers as well as the associated payment flow can have a significant impact on monetization and hence REM score.
We see some general trends — females perform better than males, older users perform better than younger users, and hard-core games perform better than casual games. However, there are also differences at a very granular level where we see certain genders and age ranges within certain countries monetize better for certain game genres. To protect the IP of our clients, we have decided to keep the specifics internal and simply publish these scores on an aggregate level for these four countries.
Conclusion
Now that we have looked at available volume, advertiser competition, and user quality, let’s relate that to market attractiveness. The data above shows that the REM score for Australia is higher than the United States while the competition for those users is lower. This is a clear indication that your marketing efforts should include the Australian users – however, does this mean you should shift your budget away from the United States?
The answer is no if you understand the relationship between volume, competition, and quality. You will notice that while those initial Australian users provide some very positive ROI, CPI rates will quickly increase given the limited population of game players available in this market. The fact remains that there are over 15 times more targetable gamers in the United States compared to Australia, meaning that CPI rates increase slower over time despite more competition for these users. For large campaigns, the United States will quickly catch up to Australia in terms of ROI as there are simply more users available at lower price points.
While the analysis of volume, competition, and quality on the big four English speaking countries is interesting, the ‘fairness’ of the open market and an educated game developer community has balanced out the economy, making it difficult to gain a strong competitive advantage with this data. However, the breakdown across Europe, South-East Asia, and other areas prove to be more interesting where we see countries that have relatively high volume, low competition, and high REM scores. It is important to keep these three factors in mind, when assessing how valuable a country can be and deciding where to put your advertising dollars. (Source: Inside Social Games)


 闽公网安备35020302001549号