分析2013年手机应用盈利性发展趋势
作者:Andreas Pappas
在去年11月份我们曾根据平台、应用类型、国家/地区等要素研究了最具盈利性的应用。现在我们将根据Developer Economics 2013针对3400多名应用开发者的最新调查数据,更新我们的分析结果。
北美开发者收益最高
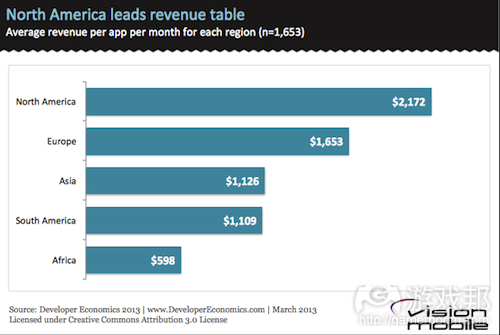
从开发者所分布的地区来看,上回调查显示美国开发者收入约是英国开发者的两倍。今年数据显示,北美(尤其是美国)开发者仍然最为领先,北美开发者所创收益比欧洲同行多30%左右,欧洲开发者收益则比亚洲同行多47%。有一部分原因是,北美用户消费能力更高,并且iOS系统普及率更高,因此北美用户收益也相对更高。注意,本项调查仅针对手机应用开发者,并且排除了处于最顶端的5%开发者,以便最小化其中的异常值。
虽然应用开发正在亚洲地区繁荣发展,并且亚洲开发者平均开发的应用数量,以及使用的手机平台数量都超过了欧美同行,但其平均每款应用月收益仍然远逊于后者。在之前的报告中,我们曾分析了这其中可能涉及的多种原因,但最主要的原因在于付费应用在主流亚洲市场并不盛行。亚洲开发者更多依靠广告创收,而从我们的调查结果来看,广告是最不具盈利性的创收模式。
北美应用开发者每款应用平均每月创收2172美元,欧洲为1653美元,亚洲为1126美元,南美为1109美元,非洲仅为598美元。
iOS盈利性仍然高于其他平台
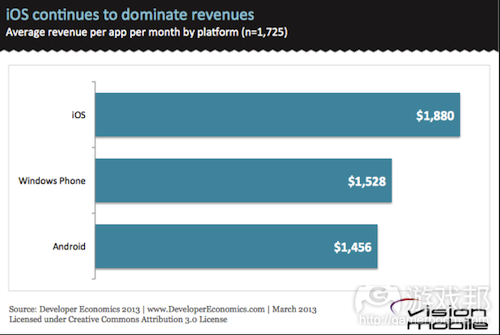
iOS仍然是平台收益冠军,平均每款iOS应用月收益比Android应用高30%,这一数据比2012年的调查结果下降了5个百分点。
每款iOS应用每月平均收益为1880美元,Windows Phone为1528美元,Android为1456美元。
Windows Phone应用在月均收益上已赶超Android,比后者高5个百分点。而在2012年调查结果中,Windows Phone应用月均收益仅为Android应用的一半左右。
跨平台应用开发者收益更高
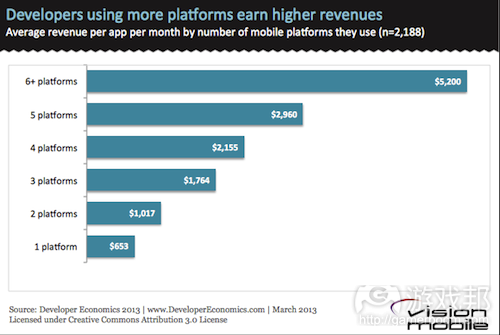
至少使用6个平台的开发者与最多使用5个平台的开发者之间存在较大的收益差距,前者收益平均比后者高75%。但仅有一小部分开发者(占比4%)至少面向6个平台开发应用,这些开发者多属于已经确立地位,希望广泛推广产品的大公司(游戏邦注:例如Facebook、Skype等)或拥有足够资源瞄准多个平台用户的大型软件公司。
仅面向一个平台开发内容的开发者可能是独立、业余,或者尚未获得足够成功的资本向更多平台扩展的开发者。随着开发者日渐成功,他们会向更多新平台扩展并创造更多收益。向更多平台并不一定能够创造更多收益,但已经获得成功的开发者更可能推行跨平台战略。
进军新市场可创造更多利润
当问及开发者将如何决定下一个项目类型,以及下一款应用将采用的盈利策略时。尽管多数开发者表示将开发自己要使用的应用(占比50%),但这显然是最不成功的策略,也不应该成为你开发下一个项目的唯一考虑因素。
使用了一些市场调查手段(游戏邦注:例如与用户交流、监测应用商店或直接购买市场调查报告)的开发者收益更为可观,至少是没有进行市场调查者的两倍左右。但进行了市场调查的开发者所占比例甚少:仅有24%开发者与用户交流,这表明多数开发者仍缺乏商业意识,开发者与用户之间仍然缺乏有效的双向沟通渠道。
从总体上看,那些将应用推向新市场、新用户群体的开发者最为成功。一定程度上可以说,这种策略更适用于那些已经被证实可行,或至少在一个市场取得成功,(对开发者来说)风险较小的应用。
开发者很难采用最具盈利性的收益模式
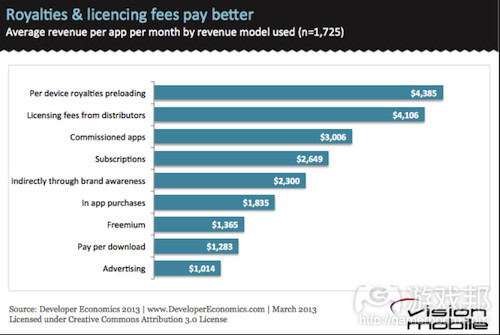
提及应用盈利性,开发者所选择的盈利模式超过10种。设备特许使用权费以及经销授权费是排名第一的盈利模式,但由于准入门槛较高,采用这种模式的开发者极少。这种模式要求开发者与设备制造商和经销商达成协议,并且要产生长期昂贵的销售循环,一开始就得提供一款成功的应用。在其他的盈利模式中,委托型应用(外包开发)排名第一,因为其风险较小,并且可让开发者根据合同获得有保证的收益。
另一种颇具利润的盈利模式是订阅模式,但也要注意:订阅服务意味着开发者需在授权上投入大量资源,并要保持高质量的内容或服务,以便持续吸引用户。
对开发者来说,最受欢迎和更具易用性的盈利模式是应用内置付费(IAP),平均比免费增值模式多创收34%,比按每次下载收费模式多创收43%。IAP和免费增值模式人气日益高涨,已被四分之一的开发者所采用。
精明的开发者善于使用工具
最后,我们要看看开发者盈利与其使用的第三方开发工具和服务之间的关系(例如用户表现追踪和管理工具)。使用Crittercism或BugSense等程序崩溃报告、漏洞追踪工具的开发者平均收益比其他同行多3倍。选择用户分析服务(例如Flurry、Apsalar)的开发者收益也相对更高,平均比其他开发者多创收168%。
富有经验的开发者一般都会选择用户分析、崩溃报告等服务,他们已经认识到优化用户获取、激活和留存用户,降低程序崩溃发生率以及用户流失率的重要性。(本文为游戏邦/gamerboom.com编译,拒绝任何不保留版权的转载,如需转载请联系:游戏邦)
Which apps make more money?
By Andreas Pappas
[How do app developer revenues vary by country, or platform? Does the number of platforms make a difference to app revenues? Which models bring in the most revenues? We revisit our November analysis of app monetisation with more insights from our Developer Economics 2013 survey across 3,400+ developers - while launching our latest survey, which is available here]
Back in November, we looked at which apps make money based on research on how app revenues vary by platform, app category, country and more. In this article we update our analysis on app monetisation based on the latest research from Developer Economics 2013 across 3,400+ app developers, including analysis that did not make it into the report.
We ‘re also proud to launch our very latest Developer Economics survey, which reaches across thousands of app developers and provides the data for our famous state of the developer nation reports. Thanks to the sponsorship by BlackBerry, Mozilla, Intel and Telefonica it possible to provide these reports and additional insights, for free, to the entire mobile community.
Take part in the survey, spread the word and help us drill deeper into the app economy and what makes it tick. We have prizes aplenty for developers, with 7 devices up for grabs (one iPhone 5, two Samsung Galaxy SIII, two Nokia Lumia 920 devices and two BlackBerry Dev Alpha handsets) – plus an AR Drone 2.0, a Nest Learning Thermostat and a Nike Fuel Band for participants who also subscribe to our developer panel. Last, but definitely not least, our friends at Bugsense are giving away one month of free crash reporting to each and every participant.
Developers in North America lead the revenue leaderboard
We’ll start by taking a look at income distribution by the region where app developers are based. Last time we saw that US developers earned almost double the revenue of UK developers. Based on our Developer Economics 2013 data, North America (and particularly the US) is still in the driving seat of the mobile app economy with developers in North America generating about 30% more than their european counterparts, who in turn generate 47% more revenue than developers in Asia. To some extent higher revenues for NA developers are explained by higher consumer spending in the US and higher penetration of iOS, which as we will see later on, still generates higher revenues than other mobile platforms. Note that across this analysis we are restricting our sample to mobile app developers, and have excluded the top 5% of revenue earners in order to minimise the effect of outliers.
While app development activity is booming in Asia, the average app-month revenue is quite lower than in the US and Europe, although developers in Asia develop, on average more apps and use more mobile platforms. As we explained in the previous article, there are multiple reasons for this revenue gap, but the prevailing reason is the fact that paid apps are not popular in most of Asia, the country that drives the Asian app economy. Instead, developers in Asia rely much more on advertising revenue, which, according to our findings is the least profitable revenue model.
iOS still monetising better than other platforms
iOS continues to dominate platform revenues, generating, on average, 30% more revenue per app-month than Android. The revenue gap has reduced by 5 percentage points compared to that reported in our Developer Economics 2012 report in June 2012.
At the same time, Windows Phone has caught up with Android and seems to be doing slightly better. Although the 5% advantage is arguably within the margin of error, Windows Phone has significantly improved its position relative to the figures reported in the Developer Economics 2012 survey, when it generated, on average, about half as much revenue as Android. How has the landscape of platform monetisation changed in Q2 2013? Join the survey and help us track the state of the developer nation.
Multi-platform developers earn more
There is a wide revenue gap between developers/publishers using 6+ platforms and those using 5 or fewer platforms, with those developing for 6+ platforms generating, on average, 75% more revenue. However, only a small part of the developer population (4%) develops on 6+ mobile platforms; these are probably established services with a large footprint that want to ensure that their apps are universally available (e.g. Facebook, Skype etc.) or large software houses with a large enough pool of resources to target multiple platforms for their customers.
Those developers employing just one platform are probably solo, amateur developers or have not yet had the success that warrants (and allows) an expansion onto more platforms. As developers become more successful, they will expand onto new platforms and generate more revenue. So while, expanding on more platforms is not sufficient to generate more revenue on its own, those that do find success are likely to invest in a multi-platform strategy.
Extending apps to new markets is a profitable strategy
We asked app developers how they decided on which apps to develop or work on next and then looked at the way revenues vary depending on their strategy. While most developers will develop apps they want to use themselves (50%), this is apparently the least successful strategy and should not become the sole deciding factor for your next app.
Developers that use some form of market research such as discussing with users, monitoring apps stores or directly buying market research are much better off, generating at least double the revenue of those who just develop the apps they want to use. However, market research is not widely used among the developer population: only 24% of developers discusses with users, highlighting a lack of business maturity and also a gap in frictionless 2-way communication channel between developers and users.
Overall, the most successful developers are those that extend apps to new markets, either to new geographies or different verticals. To some extent, these strategies rely on copying the recipe of an already established and successful business: these are apps that have been tried and proven in at least one market and are generally less risky options or “low hanging fruit” for developers. Why start from the ground up when you can stand on the shoulders of giants?
The most lucrative revenue models are off limits for most developers
When talking app monetisation, there are over 10 different revenue models to chose from. Device royalties and distribution licensing fees are the top-grossing models but are quite rare among app developers due to their high barriers to entry. These models imply deals with device manufacturers and distributors which means long, expensive sales cycles and a successful app to start with. Among the rest of the revenue models, commissioned apps (development for hire) come on top since they come with a low risk and guaranteed income for developers that work under contract.
The next most lucrative revenue model is the subscription-based model but this also comes with caveats: a subscription service implies a significant investment in licensing, and maintaining quality content or services that keeps users engaged on an ongoing basis.
Among the revenue models that are most popular and more accessible to developers, In-app purchases come on top, generating, on average 34% more revenue than Freemium and 43% more revenue than Pay-per-download. In-app purchases and Freemium models are becoming increasingly popular, now being used by a quarter of developers as they seem to be appealing to consumers. We ‘re revisiting the topic of most lucrative revenue models in our latest survey. Join in and help us size the app economy.
Smart developers use smart tools
Finally, we take a look at how developer revenues correlate to the use of third party tools and services. It’s interesting to see how app revenues correlate with usage of performance tracking and management tools like user analytics and crash reporting. Developers using crash reporting and bug-tracking tools such as Crittercism or BugSense generate on average, three times more revenue than developers who don’t use these. Similarly the usage of User Analytics (e.g. Flurry, Apsalar) services is also associated with much higher revenues, with those using user analytics services generating 168% more revenue than those who don’t.
Both user analytics and crash reporting services are used by experienced developers who recognise the importance of optimising for user acquisition, activation and retention, while reducing in-the-field crashes and the resulting user churn.(source:visionmobile)








 闽公网安备35020302001549号