研究分析虚拟商品交易在亚洲、欧洲和北美洲的销售趋势
LiveGamer和SuperData Research日前发布了关于虚拟商品交易在季节性、区域性和时间上的销售差异趋势报告。
分析称季节性的因素、国家法定节假日、宗教庆典仪式、学生返校等等都是影响用户支出指数的重要环节。
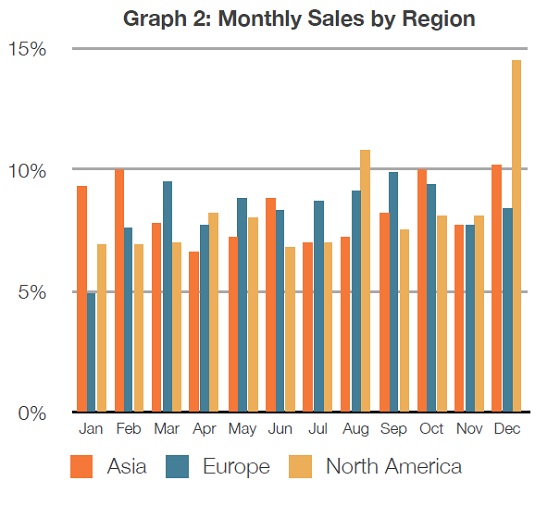
从下述列表数据可以看到在亚洲10月、12月和2月用户支出比例是最高的;而在4月、7月和8月支出比例是最低的。欧洲的情况,3月、9月和10月用户支出比例是最高的;而在1月、2月和11月用户支出比例是最低的。北美方面,4月、8月和12月用户支出比例是最高的;而在1月、2月和6月用户支出比例是最低的。
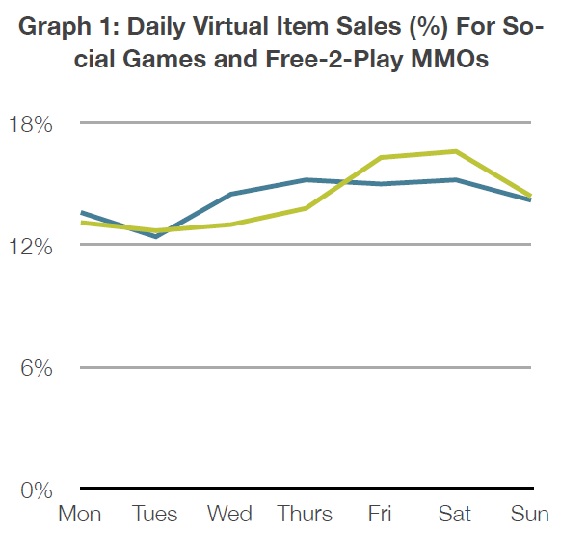
而在单周分布方面的情况(包括社交游戏和免费的大型战略网游),我们可以看到,社交游戏在周一、周二趋势比较平稳,从周三开始整个支付环节开始活跃起来;而MMO网游的情况,从周五开始喷发,至周六达到顶峰,而后开始回落。
从上面的比较可以看到社交游戏比起其他游戏类型在正常的工作时间段有更多的支付意愿用户。换句话说,游戏开发者可以根据用户的支付活动趋势来安排他们的游戏环节和优惠活动以便获得更多的虚拟营收。
而在国家比较方面,LiveGamer和SuperData Research的分析认为韩国用户习惯在一周的开始做更多的虚拟交易,而日本的用户则相反,他们支付活跃期一般从一周的中段开始到一周结束。(本文由游戏邦/gamerboom.com编译,转载请注明来源:游戏邦)
LiveGamer and SuperData Research have released two studies to date that look at virtual goods sales by seasonality, geographic regions, and days of the week. The studies look at sales trends of roughly 2.6M virtual items across 23 different titles in Asia, Europe and North America. More after the jump.
It’s no surprise that the dynamics of virtual item sales differ drastically from those of physical world. However, conditions like seasonality do have a strong impact on sales. National holidays, religious celebration and back to school times all exert influence on consumer expenditure.
In order to better understand the data, the study broke down the sample by looking at sales trends across the different continents by different months. From an aggregate perspective, overall sales dip in April and July, pick back up by October, dip again in November and climax in December. This stands in stark contrast to the packaged entertainment industry in which 50 percent of the sales took place near the end of the year. Virtual item sales on the other hand see roughly 19 percent of their sales during those months.
As shown in the graph, understanding the data from a locality and price point perspective can help paint a clearer picture of what’s going on with these sales. The highest grossing months for Asia are February, October and December, with each accounting for about 10 percent of the sales. The model is nearly the same for North America although December sales make up 14 percent. Europe’s best months are March and September. The data should be analyzed at a more granular level to understand trends across specific countries and regions as opposed to an entire continent to not miss specifics.
Another interesting point to note is that the price points of virtual items are significantly less than those of packaged items, which can range over $50 for AAA titles. With sales spread out
across the year, companies no longer have to run the risk and burden of launching massive marketing campaigns near the end of the year that all compete for the attention and dollars of consumers.
Taking this a step further, it’s also important to look at virtual goods sales by the days of the week. The second study presented data derived from the same set of 2.6M virtual items. Virtual items sales varied by type of game (free to play, social, MMO and FPS). Social games see a slow start in the beginning of the week and perk up starting Wednesday until Sunday. Free to play games see relatively the same number of sales. MMO and FPS related sales pick up on Friday and peak on Saturday, declining again on Sunday.
To summarize, virtual goods sales in social games are more prominent during the week as these games tend to be played more during office hours vs MMOs and FPS that are higher demanding. Game developers can look at the data and figure out when to offer discounted prices to drive sales in a manner similar to what retailers and grocery outlets employ.
Sales also vary by countries but what’s really remarkable is how spending patterns for the same game can vary by country. In an example from the study looking at Korean and Japanese players, Koreans tend to spend more at the start of the week vs Japanese that spend more mid to end of the week.(source:social times)


 闽公网安备35020302001549号