分析以数据挖掘技术预测用户流失情况的方法
作者:Dmitry Nozhnin
所有网络服务及在线游戏的硬伤是什么?也就是游戏开始头几分钟或几小时内出现的大量用户流失情况。已经有不少人通过多种方式探索这个问题的解决之道,其中多由界面的易用性和简洁性,免费试玩模式的有效性,难度曲线,以及新手教程质量等方面入手。这些都是公认的重要考虑因素。
而我们的目标是研究新用户为何早早退出游戏,并尝试预测哪些用户会提前离开。在此,我们以MMOPRG游戏《永恒之塔》为研究案例,但其研究结果也适用于多种服务和游戏类型。虽然这款游戏在调查期间是一款纯订阅游戏,并采用7天免费试玩至20级的模式,多数流失用户还不到付费阶段就已经离开游戏。我们主要研究的是促使用户离开的游戏内部因素。
行为研究表明,休闲玩家的注意力很有限。他们可能今天离开游戏,明天甚至就想不起来自己曾安装并玩过这款游戏。如果玩家离开游戏,我们就得立即采取措施让他们返回游戏。
但究竟该如何区分那些只是有事暂时无法登录游戏的玩家和真正的休闲玩家?最理想的方式恐怕就是在玩家仍在玩游戏时,就提前预测他们离开游戏的可能性——这种预测甚至要早于他们产生离开游戏的念头。
我们的目标很现实——在新玩家登录游戏当天就预测他们离开的概率。我们将7天处于非活跃状态的玩家定义为流失用户,目的并不是等待7天结束,确认玩家不会重返游戏,而是在他们最后一天玩游戏时预测其流失可能性。
技术支持
我们已经掌握大量数据。所幸《永恒之塔》这款韩国网游拥有理想的记录系统,它几乎可以追踪玩家每一步操作,支持查询玩家前10级,或者10小时内的玩游戏数据,可以锁定50%以上的早期流失用户。
我们使用的是两个Dual Xeon E5630 blades,它们都运行MS SQL 2008R2,其中一者作为数据仓库使用,另一个作为MS Analysis Services。我们只使用标准的微软BI软件栈。
第1阶段:误认为自己无所不知
身为富有经验,并且经历100多次测试的游戏设计师,我确信自己的能力足以解答所有关于用户流失的问题。玩家若不知如何在游戏世界中进行超时空传送,他可能就会退出游戏。首个敌人带来的致命一击,也可能让他退出。《永恒之塔》拥有绝妙的视觉效果,技术也很过硬,但却并不是一款适合新玩家的游戏。
所以我就先扮演“普通玩家”,在游戏试玩期中体验了两个种族的不同职业,详细记录了游戏玩法中的问题,并初步假设以下因素可能导致用户流失:
*种族和职业。我认为这是最主要的因素,因为发挥辅助作用的祭司的游戏玩法与强大的法师截然不同,这会影响玩家的游戏乐趣。
*玩家是否尝试过俄罗斯运营商Innova代理的其他游戏?(Innova游戏使用的是同一个帐号)
*玩家在不同程度和职业中尝试过多少个角色?
*玩家在试玩期间每个等级以及总体游戏过程中的死亡情况。
*与其他玩家的组队情况(包括高级和低级玩家)。
*玩家接收到的邮件及加入公会情况(以此检测是否存在铁杆玩家所掌握的“小号”)。
*每个等级及整个过程中完成的任务。
*在战斗中使用的技能种类。
这个列表描述了许多可能导致玩家离开游戏的因素。
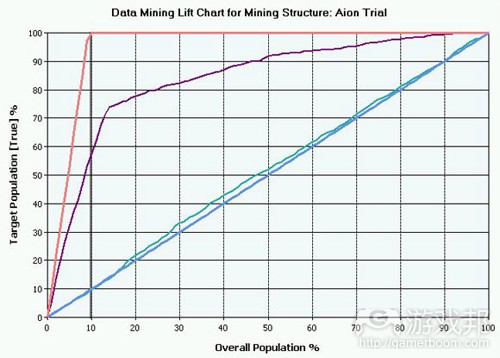
我们的第一个数据挖掘模型的理念很简单,就是将布尔型变量视为一个离开用户,它可以指出用户今天会离开游戏,还是继续在游戏中逗留一段时间:
以上图表底部直线是一个简单的随机猜测。上方飙升的线段命名为The Transcendent One,它代表未来情况。这两者间有一个波动线段,代表我们的数据挖掘模型。我们的线段越接近The One,就说明预测结果越准确。这个图表主要针对第7级用户,但对第2至9级的玩家来说并无差别。
不幸的是,从中可以看出,我们的首个模型就像是抛硬币看正反面来预测未来情况。所以我们需要抽取其他假设进行分析:
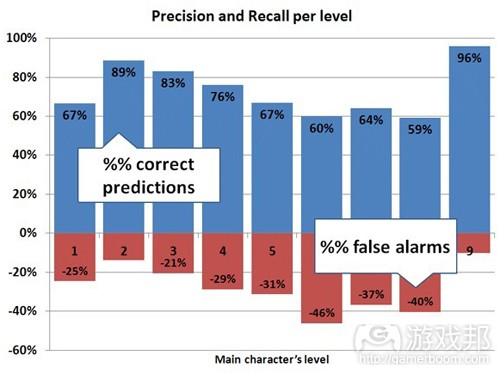
现在情况略有好转,但预测的准确性仅超过50%,误报率仍然达到了惊人的28%。
注:准确率越高,这个模型检测到的真实流失用户也就越多。误报率是指将某些玩家预测为流失用户,而实际上并非如此。
第1阶段结果:我所有的初步想法都错了。
第2阶段:发现自己完全是新手
第一个也是最简单的数据挖掘算法就是Naive Bayes(朴素贝叶斯分类器),它极具人性化并且通俗易懂。但它表明原先的假设参数无法与真实的流失用户对应。第二种方法是Decision Trees(决策树),它指出我的一些想法确实很管用,但并不足以最大化提升预测准确率。
数据挖掘算法知识:Naive Bayes在初步数据集分析以及指出参数之间关联性这方面作用很大,Decision Trees则擅长将数据集归纳为不同的子集,有利于区分流失用户及满意用户。这些方法都易于理解,但它们内部的数学原理及实用价值却极为不同。Neural Network(神经网络)本质上是一个能够计算复杂变量关系的黑盒,它可以产生更准确的预测结果,但却不易为开发者所理解。
我和《永恒之塔》团队在头脑风暴过程中讨论了新手玩家的类型,游戏行为以及其他特征。我们都知道自己的亲友初次进入游戏的过程,以及他们的感受。
这番讨论结果使我重新修订了影响新手玩家的一些游戏内部因素列表(游戏邦注:例如,玩家是否扩展了仓库大小,跳过了复活点,使用了加速移动卷轴?),以及衡量玩家在游戏中一般活动的想法。
我们使用了如下参数:
*每个等级的杀敌数
*每个等级所完成的任务
*每个等级的游戏时间(以分钟为单位)
此时我们也完全修正了ETL部分(包括数据提取、转换以及加载)的内容,我们的SQL工程师也制作了一个高级的SSIS游戏记录处理器,提升了可扩展性,有利于添加新游戏事件。记录系统的容量已达千兆字节,所以我们可以轻松添加新的假设命题。
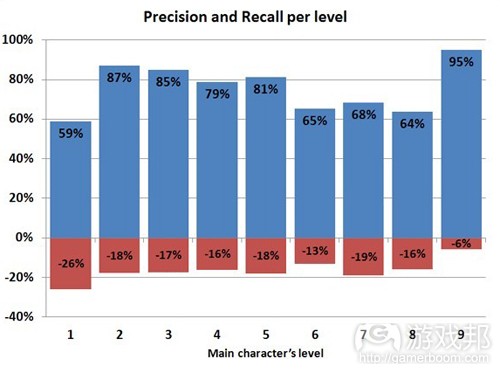
我们载入和处理新数据,审核了数据挖掘模型,并分析了结果。为了让结果更为简洁明了,在此我只发布修正后的结果:
注:第9级的准确率异常高,这与调查时期的游戏活动有关,所以可以忽略这个数据。
在此阶段,我们的模型准确率大为提高——尤其是第2级至第4级,不过6到8级的准确率仍然很不乐观。这种不准确的数据几乎没有用处。
Decision Tree表明一般活动参数正是关键的预测考虑因素。在这种情况 下,每级的游戏时间、每级杀敌数和每级完成任务等参数组成了我们预测模型的核心。其他参数对整体准确率的贡献率不足5%。另外,Decision Tree很简短,只有两三个分枝,这意味着它缺乏相关参数。我仍然无法理解为何这三个算法在不同等级的准确/召回率会如此不同。
第2阶段结果:我们通过一般活动参数取得了相当进展,虽然准确率仍然有待改进,但我们找到了正确的分析方法,即先使用Naive Bayes,之后再使用Decision Tree。
第3阶段:步入正轨
看到数据挖掘结果的准确率明显提升,我设置了三个发展向量,更多一般活动参数,更多游戏特定参数,以及更深入掌握微软BI工具。
经过对一般活动的试验之后,我们最终确定了以下关键因素:
*当前等级、之前等级及整体游戏时间
*每分钟杀敌数(包括当前/之前/整体等级情况)
*每分钟完任任务(同上)
*平均每天游戏时长
*玩游戏天数
*缺勤率(游戏邦注:这里指玩家在七天免费试玩期间缺席的天数)
这些参数极大提升了召回率(因此降低了误报率),Decision Tree最终开始尽情扩散出分枝。我们也看到不同数据挖掘算法针对所有等级的一致性,这表明预测过程已经趋于稳定,降低了随机性。Navie Byes在准确性上比Tree和Neural算法相差了足足10%。
新加入的个体参数实际上非常难以管理,手动分离自动攻击使用情况要涉及一些数学知识,SQL查询的第75百分位计算也是如此。但我们标准化了数据,因此可以对比不同的游戏职业,数据挖掘模型接受的是分类索引数据而非原始数据。标准化和索引化新个体参数使整体预测精确度又提升了3-4%。
注:在网络游戏中,角色要使用技能及能力进行攻击。自动攻击是最基本和自由的招式。资深玩家使用所有技能时他们的自动攻击比率就会较低,不过游戏及职业机制也会深刻影响这一参数。在《永恒之塔》中,法师这一比率的中间值是5%,而战士则是70%,即使是在同个职业中,标准偏差也会很高。
下一步就是参考《Data Mining with Microsoft SQL Server 2008》这本书,从中查找使用分析服务的决窍。这本书很有助于解释Decision Tree微调的复杂原理,它还让我认识到了正确数据离散化的重要性。
在以上例子中,我们通过手动操作实现了自动攻击参数的离散化。我刚开始处理这些数据时,就发现SQL Server的自动离散化是可以并且应该进行微调。手动调整数据会极大影响Tree的形状和精确度(对其他模型也同样会有影响,但是对Tree的影响更明显)。
我花了一整周时间挨个调整9个挖掘结构的30多个维度(每个游戏等级有一个结构,一共有9个等级)。从这一试验中可以发现一些有趣的模式,并且可轻松将7级和8级之间的精确度提升2%。例如,杀敌数是20,整体游戏时长是12,而每级游戏时长是7。
微调之后的结果极大减少了误报率,将Tree的数据提升至与Neural Network相当的水平:
第3阶段结果:我们终于得到了一些合适的数字,也搜集了大量关于玩家的有趣数据。
第4阶段:获得成功
坦白说,我认为我们已经到达到准确预测的极限。新参数和假设并没有再度提升精确度,这些模型已经稳定。78%的精确度 VS 16%的误报率已经足以展开预测流失用户的工作。
以免费订阅或高价值道具刺激他们重返游戏并不一定奏效(因为在俄罗斯这些赠品也支带来一些增值税),但向他们发个邮件总不会有什么问题吧?
当我们的数据挖掘项目进入第三个月时,我们发现数据有点过时了,因为那时的游戏已经更新了数次补丁。
重新载入这三个月所有更新、更大的数据集时,我发现了梯度图表发生了一些变化。虽然精确度/召回率仍然保持原状,但数据表现略有差别。
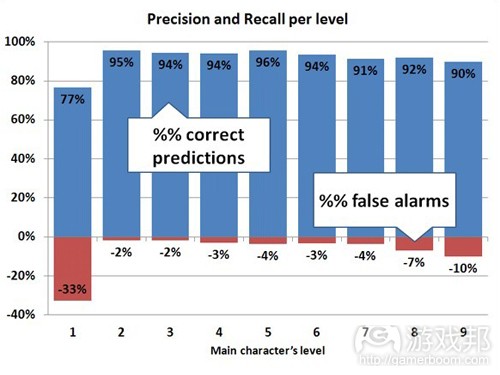
需要再次重新编写ETL程序,此时每个等级处理时间不足1分钟,所以增加一个数据集的等待时间是我们尚可接受的5分钟。但不幸的是,所以手动微调工作都要重做,不过从以下图表可以看出,增加数据集后,我们极大提升了模型的有效性!
但针对第1级的情况,我们确实无能为力。正如网络分析大师Avinash Kaushik所言,“我来,我吐,我闪”(I came, I puked, I left)。这些玩家创建了自己的角色之后就退出了游戏,我们针对他们的行动记录也非常之少。
以上所有数字均出自历史数据以及我们挖掘模型的一个学习数据集。但我是一个非常多疑的人,我还想要战斗测试结果。所以我们采用了新玩家(今天才注册的用 户)数据,将其引进预测模型,并保存结果。7天之后,我们对比了一周前的预测流失用户以及他们真实的行为,获得了如下结果:
结果
我们终于成功实现了预测玩家是否将退出游戏的这一最初目标。看到如此之高的精确度/召回率,我们确信自己的积极和专注获得了回报。
但我们是否实现了第二个目标,判断玩家为何离开?没有。对我来说,这也是最有趣的结果——我们已经知道玩家可能离开的概率,却仍然不晓得他们为何离去。我在本文开篇列出了可能导致玩家早早离场的假设因素:
*种族和职业
*玩家是否尝试过其他的Innova游戏(我们用同一个帐号)
*玩家尝试过的种族和职业角色数量
*在免费试玩期间每级和整体死亡情况
*以及其他多种因素
我们测试了60多种个体及游戏特定参数。发现没有一者是导致用户离开的主因!也就是说,我们没有发现阻碍用户享受游戏乐趣的主要因素。
这个调查中的关键参数比较适用于试玩游戏首天的所获等级的情况,但低于考查7级游戏情况的需求,这相当于3个小时的游戏时间,意味着此时的用户流失率极高。另一批预测流失率的参数主要与整体活动有关:
*每级杀敌数
*每级完成任务
*每级游戏时长(分钟)
*每天游戏时长
总结
我们历时三个月,研究了两本书,并投入大量精力和热情从头创建了这个数据挖掘项目。团队中没有人曾有这方面经验。我们为Innova被动的分析系统中制造了一个富有前瞻性的预测工具。我们可以及时接收潜在的流失用户信息,并给予他们一些极富个性化和关联性的决窍以提升游戏体验。
这个项目是针对《永恒之塔》这款MMOPRG而创建,但它也适用于其他游戏类型,甚至是一般的网络服务。
这是我们的首个数据挖掘项目,结束时间是2011年9月,并已根据我们现有的预测经验,聚类及分散分析,以及对用户群体的深入了解进行了重新编写,所以这个数据挖掘历程仍远未结束。(本文为游戏邦/gamerboom.com编译,拒绝任何不保留版权的转载,如需转载请联系:游戏邦)
Predicting Churn: Data-Mining Your Game
by Dmitry Nozhnin
The sad truth about all online services and games? The most significant churn occurs right the first minutes and hours of gameplay. The issue has been already explored in a numerous ways, with many profound hypothesizes related to usability and simplicity of interface, availability of a free trial, learning curve, and tutorial quality. All of these factors are considered to be very important.
We set a goal to investigate why new players depart so early and to try to predict which players are about to churn out. For our case study, we used the MMORPG Aion, but surprisingly, the results appear to be applicable to a wide array of services and games. Although Aion, at the time this study was undertaken, was a purely subscription-based game with a seven-day free trial capped at level 20, the vast majority of churners left long before they had to pay to keep playing. Our research was about in-game triggers for churn.
Behavioral studies show that casual players have a limited attention span. They might leave the game today, and tomorrow won’t even recall that it was ever installed and played. If a player left the game, we have to act immediately to get her back.
But how can we differentiate players who churned out of the game from casual players who just have plans for an evening and won’t log in for a while? The ideal way would be predicting the churn probability when the player is still in the game — even before she actually thinks about quitting the game.
Our goal was more realistic: to predict new players’ churn the day they logged in for the last time. We define churn as inactivity for 7 days, and the goal was not to wait for a whole week to be sure the player has left the game and won’t return, but instead to predict the churn right on their last day of play. We’d like to predict the future!
The Tech Side
We had tons of data. Fortunately, Aion has the best logging system I’ve ever seen in a Korean game: it traces literally every step and every action of the player. Data was queried for the first 10 levels, or about 10 gameplay hours, capturing more than 50 percent of all early churners.
It took two Dual Xeon E5630 blades with 32GB RAM, 10TB cold and 3TB hot storage RAID10 SAS units. Both blades were running MS SQL 2008R2 — one as a data warehouse and the other for MS Analysis Services. Only the standard Microsoft BI software stack was used.
Phase 1. I Know Everything!
Having vast experience as a game designer, with over 100 playtests under my belt, I was confident that my expertise would yield all the answers about churn. A player fails to learn how to teleport around the world — he quits. The first mob encountered delivers the fatal blow — she quits. Missed the “Missions” tab and wondered what to do next — a possible quit, also. Aion is visually stunning and has superb technology, but it’s not the friendliest game for new players.
So I put on my “average player” hat and played Aion’s trial period for both races with several classes, meticulously noting gameplay issues, forming a preliminary hypothesis list explaining the roots of churn:
•Race and Class. I assumed it would be the main factor, as the gameplay for the support-oriented priest radically differs from the powerful mage, influencing player enjoyment.
•Has the player tried any other Innova games? (We have a single account)
•How many characters of what races and classes have been tried?
•Deaths, both per level and total, during the trial
•Grouping with other players (high level and low level)
•Mail received and guilds joined (signs of a “twink” account run by a seasoned player)
•Quests completed, per level and total
•Variety of skills used in combat
The list was impressive and detailed, describing numerous many ways to divert the player from the game.
So let’s start the party. The first hypothesis went to data mining models. The idea is very simple: we predict the Boolean flag is leaver, which tells whether the player will leave today or keep enjoying the game at least for a while:
Lift Chart 101: The bottom straight line is a simple random guess. The upper skyrocketing line is The Transcendent One, who definitely knows the future. Between them is the pulsing thin line, representing our data-mining model. The closer our line is to The One, the better the prediction power is. This particular chart is for level 7 players, but the picture was the same for levels 2 to 9.
Fatality! Our first model barely beasts a coin toss as a method of predicting the future. Now it’s time to pump other hypotheses into the mining structure, process them, and cross our fingers:
Well, it looks better, but still, precision is just a bit over 50 percent, and the false positives rate is enormous, at 28 percent.
Precision and Recall 101: The higher the precision, the more true leavers the model detects. False positives are those players predicted as churners, when in reality they aren’t.
Phase 1 Result: All my initial ideas failed. Total disaster!
Phase 2. I Am a Total Noob
The first and simplest data-mining algorithm is naive Bayes, which is extremely human-friendly and comprehensible. It showed that the hypothesis metrics do not correlate with real churners. The second method, Decision Trees, revealed that a few of my ideas were actually quite useful, but not enough to boost the prediction precision to the top.
Data Mining algorithms 101: Naive Bayes is great at preliminary dataset analysis and highlighting correlations between variables. Decision Tree reduces the dataset into distinct subsets, separating the churners from happy players. These methods are both human-readable, but quite different in their underlying math and practical value. Neural Network is essentially a black box capable of taking complex variable relations into account, and producing better predictions, at the cost of being completely opaque for the developer.
I brainstormed with the Aion team, and we had a great time discussing our newbie players — who they are, how they play, and their distinct traits. We remembered how our friends and relatives first stepped into the game and how their experience was.
The result of this brainstorming session was a revised list of in-game factors affecting newbie gameplay (had she expanded the inventory size, bound the resurrection point, and used the speed movement scrolls?) and also the brilliant idea of measuring the general in-game activity of players.
We used the following metrics:
•Mobs killed per level
•Quests completed per level
•Playtime in minutes per level
By that time, we had also completely revamped the ETL part (extraction, transformation, and loading of data) and our SQL engineer made a sophisticated SSIS-based game log processor, focused on scalability and the addition of new game events from logs. Given the gigabytes of logs available, it was essential that we be able to add a new hypothesis easily.
New data was loaded and processed, models examined and verified, and results analyzed. For the sake of simplicity, I won’t post more lift charts, but instead only the refined results:
Level 9′s anomalous high precision was game-related at the time of research, so disregard that data.
At this stage, our models improved their prediction power — especially levels 2 to 4 — but 6 to 8 are still way too bad. Such imprecise results are barely usable.
Decision Tree proves that general activity metrics are the key prediction factors. In a sense, playtime per level, mobs killed per level, and quests completed per level metrics comprised the core prediction power of our models. Other metrics contributed less than 5 percent to overall precision. Also, the Decision Tree was rather short, with only two or three branches, which means it lacked the relevant metrics. It was also a mystery to me why all three algorithms have variable precision/recall rates from level to level.
Phase 2 Result: We’ve achieved considerable success with general activity metrics, as opposed to specific game content-related ones. While precision is still not acceptable, we’ve found the right method for analysis, using Bayes first and Tree afterwards.
Phase 3. On the Right Track
Inspired by visible improvements in the data mining results, I set up three development vectors: more general activity metrics, more game-specific metrics, and a deeper learning of the Microsoft BI tools.
Experimenting with general activity, we finally settled on the silver bullets:
•Playtime at current level, previous level, and total during lifetime
•Mobs killed per minute (current/previous/lifetime)
•Quests completed per minute (same)
•Average playtime per play day
•Days of play
•Absenteeism rate (number of days skipped during the seven day free trial)
Those metrics accounted for massive increase in recall rate (thus fewer false positives, which is great news!) Decision Tree finally started branching like there is no tomorrow. We also saw the unification of different data-mining algorithms for all levels, a good sign that the prediction process was stabilizing, and becoming less random. Naive Bayes was lagging behind the Tree and Neural by a whopping 10 percent in precision.
New individual metrics actually were quite a pain to manage. Manual segmentation for auto-attack use involved some math, and things like 75th percentile calculation in SQL queries. But we normalized the data, allowing us to compare the different game classes; the data mining models received category index data instead of just raw data. Normalized and indexed new individual metrics added a solid 3 to 4 percent to overall prediction power.
Combat 101: In online games, characters fight with skills and abilities. Auto-attack is the most basic, free action. Experienced players use all skills available and their auto-attack percentage will be lower — although game and class mechanics heavily influence this metric. In Aion, the median for mage is at 5 percent while the fighter is at 70 percent, and even within a single class, the standard deviation is still high.
The next move was reading the book Data Mining with Microsoft SQL Server 2008 in search of tips and tricks for working with analysis services. The book itself was helpful for explaining the intricacies of Decision Tree fine-tuning, but it also led me to realize the importance of correct data discretization.
In the example above, we’ve manually achieved discretization of the auto-attack metric. The moment I started tinkering with the data, it became obvious that SQL Server’s automated discretization could and should be fine-tuned. Manually tuning the number of buckets heavily affects the Tree’s shape and precision (and that of other models too, for sure — but for the Tree, changes are most visible).
I’ve spent a whole week of my life tuning each of the 30+ dimensions for each of the nine mining structures (one structure per game level; nine levels total). Experimenting with the buckets revealed some interesting patterns, and the difference between seven and eight buckets could easily be a whopping 2 percent precision increase. For example, the mobs killed bucket count was settled at 20, total playtime at 12, and playtime per level at 7.
Fine-tuning yielded a great decrease in false positives, and boosted the Tree up to the numbers for Neural Net:
Phase 3 Result: Finally, we’ve got some decent figures, and we’ve also gathered a lot of interesting data about our players.
Phase 4. For the Win!
Frankly, I thought we’d hit the ceiling for accurate prediction. New metrics and hypotheses do not contribute to precision; the models are stable. 78 percent precision / 16 percent false positives is enough to start working on churn prediction.
Motivating these players with free subscriptions or valuable items probably won’t be efficient (taking into account the VAT tax associated with such gifts in Russia) but emailing these players couldn’t hurt, right?
An unexpected gift: As we were in our third month of the data-mining project, we realized the data might become outdated, as the game received several patches during that time.
Reloading the new, larger dataset for all three months, I noticed some changes in the lift charts. The data was behaving slightly differently, although the precision/recall stayed the same.
ETL procedures were rewritten from scratch again, and the whole three-month dataset was fed to the hungry data-mining monster.
At that time, processing time per level was less than a minute, so an increased dataset resulted in an acceptable 5 minute wait time. Unfortunately, all manual fine-tuning had to be redone, but look at the picture:
Increasing the dataset, we’ve hugely boosted the efficiency of the models!
For the first level, unfortunately, we can’t really do anything. As Avinash Kaushik would say, “I came, I puked, I left”. Those players left the game right after creating their character and we have few, if any, actions logged for them.
All those numbers above were historical data and a learning dataset for our precious mining models. But as I’m a very skeptical person; I want the battle-tested results! So we take fresh users, just registered today, and put them into the prediction model, saving the results. After seven days, we compare the week ago predicted churners with their real life behavior. Did they actually leave the game or not?
Outcomes
Our original goal — to predict players about to churn out of the game — was successfully achieved. With such high precision/recall we can be confident in our motivation and loyalty actions. And I remind you that these are just-in-time results; at 5:30 am, models get processed, new churners are detected, and they’re ready to be incentivized the moment we come into the office in the morning.
Have we achieved our second goal, determining why players churn out? Nope. And that’s the most amusing outcome for me — knowing with very high accuracy when a player will leave, I still don’t have a clue why she will leave. I started this article listing hypothesizes about causes of players leaving the game early:
•Race and Class
•Has the player tried any other Innova games (We have a single account)
•How many characters of what races and classes have been tried
•Deaths, both per level and total during the trial
•And many others
We have tested over 60 individual and game-specific metrics. None of them are critical enough to cause churn. None of them! We haven’t found a silver bullet — that magic barrier preventing players from enjoying the game.
The key metric in this research appears to be the number of levels gained during the first day of the trial. Fewer than seven levels — which represents about three hours of play — means a very high chance to churn out. The next metrics with high churn prediction powers are overall activity ones:
•Mobs killed per levels
•Quests completed per levels
•Playtime in minutes per levels
•Playtime per day
Results
It took us three months, two books, and a great deal of passion to build a data-mining project from scratch. Nobody on the team had ever touched the topic. On top of our robust but passive analytics system at Innova, we’ve made a proactive future predicting tool. We receive timely information on potential churners and we can give them highly personalized and relevant tips on improving their gameplay experience (all of those 60+ metrics provide us with loads of data).
The project was made for a specific MMORPG, Aion, but as you can see, a major contribution came from generic metrics approaches applicable to other games, and even general web services.
This was our very first data-mining project, finished in September 2011, and it has been rewritten completely since then, based on our current experiences with predicting the churn of experienced players, clustering and segmentation analysis, and a deeper understanding of our player base. So the data mining adventures are to be continued…(source:gamasutra)







 闽公网安备35020302001549号