从经济角度预测社交游戏收益情况(下)
作者:Brian Poel
如果你未读过本文上部内容,就需要先了解新玩家、一周玩家和留存玩家间的关系以及联系这几种类型间的流失率,以及成熟游戏和新游戏中玩家行为和度量状况随时间的改变与你游戏的寿命周期有关。
病毒性
几乎所有人都知道,Facebook的病毒性在过去数年来改变了很多。你不能再只依靠病毒性来刺激游戏成长。然而,这仍然是个非常重要的驱动因素,它不仅能够降低你的用户获取成本,还有机会让你在无需巨额营销预算的前提下让用户飞速增加。因而,如果你能够利用病毒性成长,那么可以投入更多精力,但不可完全依靠它获得成功。
玩家分类:需要声明的是,病毒性对新玩家、一周玩家和留存玩家而言是不同的。
对新玩家而言,如果他们在第二天不会再玩游戏,那么他们发出邀请的可能性就不高了。我的模型的间隔是以每周为单位,但我仍然会赋予新玩家群体些许病毒性。虽然这种做法并不完美,但总比不给此群体设定任何病毒性要好。
一周玩家指那些决定继续玩下去,并且很有可能发出邀请来构建“邻居”用于游戏内互动的玩家群体。前两周的度量便是值得关注的关键数值,尤其是游戏发布时。
对于留存玩家而言,他们或许在刚开始玩游戏的时候就会发出邀请。因而,他们的病毒性不如一周玩家。
变化范围:
欠佳:0.05 K factor
中等:0.20
优秀:0.40
注意:根据新玩家、一周玩家和留存玩家以及游戏的成熟度来调整。
参与度
AppData上有大量日活跃用户和月活跃用户的数据。我建议你去那个网站上考察大量不同游戏的表现。
尽管你可以从所有那些流行游戏中发现与预想相符的变化幅度,但重要的是,你会注意到有些游戏的DAU/MAU的比值很高,但MAU总数却较小。所以,用户的参与度取决于你所吸引的用户类型和你的游戏所鼓励的行为。
在Casual Connect大会欧洲专场上,Wooga的Stephanie Kaiser发表了一个很棒的演讲。尽管演讲的名称上说的是“病毒性”,但演讲中大部分讨论的都是用户参与度问题。玩家间的消息确实是玩家在替你做推广,但事实上他们是在现有玩家间推广参与度,并提升日活跃用户。而预测模型中所使用的病毒性是将游戏推向那些并未玩游戏的玩家。
玩家分类:和病毒性类似,新玩家、一周玩家和留存玩家的日活跃使用也有所不同。新玩家的访问率或许会更高,因为他们刚刚开始学习游戏。但是一旦他们掌握了游戏,行为就会发生改变。许多游戏依靠“约定计划”来让用户保持访问游戏的频率。
变化范围:
欠佳:10% DAU/MAU
中等:25%
优秀:40%
注意:根据新玩家、一周玩家和留存玩家以及游戏的成熟度来调整。
玩家消费
或许你会认为,近期在网站或大会演讲中公布的玩家花费具体数据相对较少。游戏公司将此类数据深藏起来,或让其他人无法从公布数据中分析出具体的数值。
鲸鱼用户:在游戏中花费大量金钱的小部分付费玩家。免费增值游戏的魅力在于,玩家在游戏中的花费没有上限,如果你最大限度地开发这种可能性就有可能产生鲸鱼用户。这类玩家甚至有可能每月花上1000美元。
平衡ARPU(游戏邦注:即“每用户平均盈利”)和DAU:总的来说,你的游戏越适合某个用户群体,你的潜在用户数量就越少,但你的ARPU有可能会越多。相对来说,满足大众玩家诉求的游戏或许有庞大的玩家基础,但是付费玩家的百分比也较小,这样自然就会影响到ARPU度量。
ARPU与ARPPU(游戏邦注:即“每付费用户平均盈利”):你需要从以上两种方法中选择一种,或者计算DAU并得出某类玩家的ARPU,或者计算付费用户百分比以及DAU得出某些玩家的ARPPU。
两种方法都能够对预测发挥作用,但是在我的模型中,我更偏好前一种方法。
新玩家:正如我在上文中讨论病毒性那样,为新玩家群体分派购买行为是一件很棘手的事情,因为他们有时候第2天就不会再接触游戏(游戏邦注:随着游戏成熟情况会更加糟糕)。然而,有些玩家在一开始玩游戏时就会深入其中并开始花费金钱,因而将此类玩家的购买行为定为0也是个不正确的做法。只是在处理这部分度量时需要小心谨慎,还需要在游戏成熟时将期望数值下调,因为高流失率会导致ARPU下滑。
变化范围:
欠佳:0.01美元 ARPU
中等:0.035美元
优秀:0.06美元
注意:根据新玩家、一周玩家和留存玩家以及游戏的成熟度来调整。
运营维持成本
这个类别很难用标准化的范围来定义,因为这取决于你的团队、游戏范围以及所采取的运营措施。比如,5人团队的运营成本就同Zynga新产品的运营成本天差地别。
你需要弄清楚的两个度量是固定成本和可变成本。
固定成本指那些负责管理项目的员工以及某些外包合作成本。你可以计算出项目所需承当的固定经费,如人力资源、管理、照明以及租赁等费用。
可变成本的多寡取决于游戏中其他某些度量。比如,玩家数增多导致你需要使用更多服务器提供支持,与此相关的IT成本就属于可变成本。
你也应当将内容创造视为可变成本,将其与游戏总体盈利联系起来。成功的游戏便需要更多的成员来开发内容,如果游戏不是很成功,或许你应该削减这部分的成本。但是,这取决于你分配资源的方法以及对“成功”的定义。
前些部分我已经列举了所有的变量以及这些变量的变化范围,下文我将重点阐述该预测工具以及如何在发布前后使用这个工具。
如何阅读电子数据表范例
我在这篇文章中插入了某些预测电子数据表的截图。蓝色的单元格代表数据点,其数据值已经在之前的文章中表述过了。电子数据表的用户可以编辑的是黄色的单元格。需要特别指明的是,“USE THIS”列中的单元格所涉变量数值与电子数据表中的复杂运算有很大的关联。所以,你可以根据蓝色单元格中的变量范围选择某个数值输入到“USE THIS”黄色单元格中,或输入你自己的自定义变量数值。这个数值可以是蓝色单元格数值范围内,也可以位于该范围数值之外,因为有些人可能想看下年净盈利或用户曲线图。
付费用户获取
以下是付费用户获取的预测模型。单元格根据之前的文章划分成欠佳、中等和优秀三种数值。
用户每月购买中分为低、中、高三类黄色单元格,你可以在此输入自己的预算范围。这里没有标准化的范围,因为这取决于你自身的预算潜力。注意:尽管模型是以周为单位来计算,但在这项统计中我把单位设为每月,因为通常分派营销预算是以月为单位。
模型根据这些预算值和“USE THIS”列中各游戏成熟阶段的CPA值来计算出用户的数量。
免费用户获取
这部分的预测展示出你可以免费获取多少用户。正如之前说过的那样,如果你已经发布多款游戏,那就可以免费向现有用户交叉推广新游戏。如果没有多款游戏,你或许可以使用Applifer服务来增加额外的曝光度,而不用购买Facebook广告。
黄色单元格中的数值是来自Applifer的估算值,如果你有特别的用户获取渠道,那么应该自行输入相关数值。
玩家数量流失
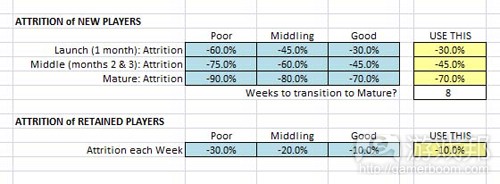
这部分预测的是不同玩家数量的流失率。我们之前说过,游戏在发布前期和成熟后的流失行为是不同的。
注意:我并未给一周玩家群体赋予特别的流失率。新玩家和一周玩家使用的流失率数值是相同的,接下来我就开始使用留存玩家流失数值。我固然可以在这里设置多个不同的数值,但是我觉得没必要这么做。在模型早期的版本中,我绘制了更详细复杂的用户曲线。但是在另一项研究中,我发现用户群体很快就会转化到持续流失行为。
病毒性用户获取
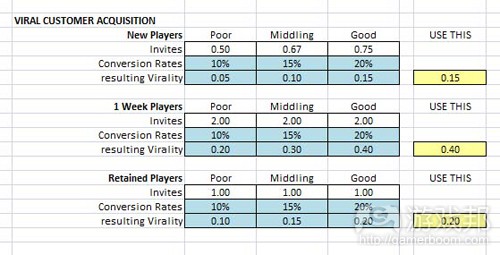
这部分模型反映的是不同玩家群体的病毒性行为。值得注意的是,在蓝色数据单元格中,我使用的是最终的K因素和某些预想的点击率数值,由此来计算邀请的数量。尽管最终模型所用的还是K因素(游戏邦注:“USE THIS”列黄色单元格所示),但你还需要追踪邀请数和转化率,这样你才可以提升游戏中的这些数值。
玩家付费
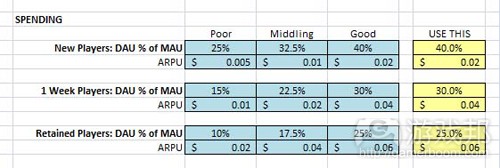
在上篇文章中,我决定使用ARPU * DAU %的方法来计算玩家付费。这种类型的变量肯定需要在你自己进行预测时监测和计算。你可以将用户以周为单位来划分,随着玩家在游戏中耗费时间的增多,你可以不断追踪玩家付费行为的趋势。随着游戏逐渐成熟,你也会看到这些变量会发生变化。新玩家的付费或许会比那些在4至6月游戏成熟后付费的玩家要多。而且,你也必须注意游戏成熟阶段的新玩家,因为流失率有可能会高得多。当选择继续玩游戏的新玩家数减少时,你应当随之下调ARPU期望值。在这些图标的元素中,我并没有让模型自动进行调整,因为这部分调整很复杂,而且也是模型需要进行改良的地方。
敏感度分析
一旦你成功建立起适合游戏的变量值,你就可以根据各个变量的敏感度分析来绘制出图表,看到失败、缓慢成功和快速成功中的关键因素。
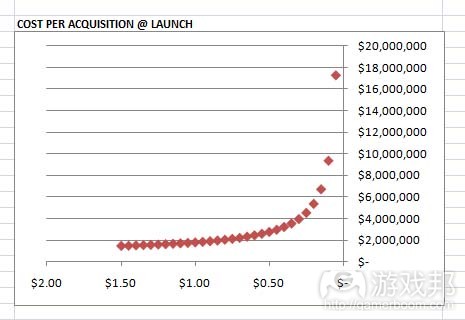
发布时的CPA:
这是个发布时用户获取价格的敏感度曲线的范例。依图中所示,用户获取成本在0.25美元时年净盈利开始急速飙升。这反映出,发布时该预算使得游戏获得大量用户。
很显然,从这里我们可以总结出,当成功游戏在发布期间其他关键度量参数(游戏邦注:如留存率、用户付费等)表现良好时,你可以利用这个机会来降低用户获取成本,这种做法可以带来丰厚的回报。
留存玩家流失率
这个图表显示出各个不同层次的留存玩家消耗率对年净盈利构成的影响。与CPA一样,这两者间也不是线性关系。转折点似乎在-10%的流失率上。如果流失率的表现比这个数值要好,那么就有稳定数量的留存玩家为你提供盈利。
尽管第1天和第1周的流失率对未来的成功至关重要,留存玩家的稳定性会让你的盈利持续更长时间。
随时间进展管理预测
预测并非只是用于制定发布前计划。在你获得实时数据时,将其输入电子表格中的对应周的单元格中,公式也可以为你计算出预测数据。预测仍然可用于推算将来的情况,而且像总净盈利和年终玩家数量等目标可都能够制定得更为准确。而且,你当然也可以根据预测变量来判断游戏当前状态是欠佳、中等还是优秀。在所有类别都取得优秀评价固然很难,但预测反映的是真实的情景,而并非不切实际的一味乐观。这样,你才会知道游戏哪些地方需要得到改善。(本文为游戏邦/gamerboom.com编译,如需转载请联系:游戏邦)
Financial Forecasting for Social Games
Brian Poel
Last week, I began digging into the key performance metrics for financial forecasting of social games. This week, I’ll finish the rest of the variables defined in week 1, along with additional supporting links where appropriate.
Player Populations
If you haven’t read Part 1 of this series, be sure to check out the section on Player Populations for the relationship between New Players, One Week Players, and Retained Players and how Attrition Rates connect them.
Mature Games vs. New Games
If you haven’t read Part 2 of this series, be sure to check out the section on Mature Games vs. New Games for how user behavior and metrics performance can shift over time depending on how far along you are in your game’s lifecycle.
Virality
As everyone knows, virality on Facebook has changed a lot over the past year. No longer can you depend on virality alone to spur growth. It’s still a very important driver, though, as it not only acts as a discount on your Cost of Customer Acquisition, but also creates opportunity for truly explosive population growth, without needing a huge marketing budget. So if you can generate viral growth, more power to ya, but don’t depend on it completely for success.
Kontagent’s GDC presentation quotes a K factor of only 0.05 to 0.20. Wow, that’s really far away from the magical 1.0!
Player Populations: An argument could be made that Virality is different for New Players, One Week Players and Retained Players.
For New Players, if they don’t even stick with the game after Day 1, it seems highly unlikely that they will send out any invites. Since the granularity of my model is at a Weekly level, however, I still assign some virality to the New Player pool, but at a lower level (since this metric is being applied to the larger pre-attrition total). It’s not perfect, but it’s better than applying zero Virality to this population.
The One Week Players represent the population of players who have decided to keep playing and are most likely to send out invites to build their initial base of “neighbors” for in-game interactions. This two week window (covering both populations) is a critical metric to watch, especially at launch.
For Retained Players, they may have done most of the inviting their likely to do when they initially started playing, not several months into playing. Therefore, their virality is going to be less than the One Week population.
Variable Ranges:
Poor: 0.05 k factor
Middling: 0.20
Good: 0.40
note: adjust this for New, One Week, and Retained Players, and for Game Maturity
Engagement
There’s lots of data out there on Daily Active Users and Monthly Active Users, because of App Data (http://www.appdata.com/). I encourage you to go there and poke around on lots of different games.
While there are certainly some expected ranges if you look at all of the biggest games, it’s important to note that niche titles may have much higher DAU % but on a much smaller base of MAU. So it really depends on the kind of audience you’re attracting and the behavior that your game encourages.
At Casual Connect Europe, Stephanie Kaiser from Wooga gave a great presentation. While the title says it’s about “virality”, most of the talk is really about engagement. Yes, player-to-player messaging is ‘viral’ in the sense that the players are doing the promotional effort for you, but they’re promoting engagement between existing players and encouraging higher Daily Active Usage (see the 38:35 minute mark)– contrast this with promoting to people not currently playing, which would be the virality that the forecasting model uses.
Player Populations: Just as with Virality, Daily Active Usage is likely different for New Players, One Week Players and Retained Players. New Players may have much higher visitation as they are initially learning the game, but as they master the game, behavior can change. Many games that rely on ‘scheduling’ can shift focus into longer periods between visits as the in-game rewards (coins, XP) for shorter turn-around tasks becomes less meaningful for game progress.
Variable Ranges:
Poor: 10% DAU/MAU
Middling: 25%
Good: 40%
note: adjust this for New, One Week, and Retained Players, and for Game Maturity
Player Spending
As you might guess, accurate data on player spending is fairly sparse out there on the interwebs or in conference presentations, at least anything recent. Game companies wisely keep this kind of data to themselves, or obfuscate it enough so folks can’t pin down anything too specific about what’s going on behind the curtain.
In Kontagent’s GDC presentation, they say that typical Average Revenue Per User (ARPU) is just $0.01 to $0.05 per day. Another way to measure it is looking at the percentage of paying users (1% to 3%) and then the Average Revenue Per Paying User (ARPPU), which they say is typically $2 to $10+.
Whales: That “+” at the end of Kontagent’s ARPPU estimate is worth emphasizing. A small portion of paying users spend a LOT on these games. The beauty of freemium games is that there’s no upper limit on spending, and Whales are what happens when you open up that possibility. We’re talking about over $1,000 a month as a possibility. Clearly this kind of anomalous behavior can play havoc with statistics — when your Average revenue and your Median revenue are so far apart, some of these ARPU and ARPPU numbers can be misleading as to what’s really going on behind the scenes.
Balancing ARPU and DAU: As a generalization, the more niche your title, the smaller your potential population but the better your ARPU is likely to be. In contrast, a mass-appeal title may have a huge player population, but a smaller % of them are likely to pay, which is going to drag down on your ARPU metric.
ARPU vs. ARPPU: you need to pick one of these two approaches, either a) calculate your DAU and apply an ARPU to that pool of players, or b) calculate a % of players who are paying, apply that to your DAU, and then assign an ARPPU to that pool of players. Either one is workable, but for my model I go with the ARPU * DAU approach.
New Players: as I commented earlier about Virality, it’s tricky assigning purchasing behavior to the New Player population when many of them won’t stick around even past Day 1 (which will get worse as the game matures). Some players, however, are going to jump in with both feet and start spending money, so it’s likewise not fair to assign zero to this population. Just be cautious, and also adjust your expectations downward for when the game is mature, since the higher attrition rate should be reflected in smaller ARPU.
Variable Ranges:
Poor: $0.01 ARPU
Middling: $0.035
Good: $0.06
note: adjust this for New, One Week, and Retained Players, and for Game Maturity.
Ongoing Operations Costs
This is a hard category to apply any standardized variables to, because it depends on your own team, the scope of the game, and how much formality you’re looking to put in place. There’s a big difference between a 5 person garage team and all of the infrastructure that Zynga has in place for a new title.
The two things you need to figure out are Fixed costs and Variable costs.
For Fixed costs, these are mostly going to be staffing allocated to the project, and perhaps some contractual relationships (like paying Kontagent for their services!). And if you want to get fancy, you can calculate whatever portion of company overhead (HR, executives, lights and rent) that your project is saddled with.
For Variable costs, these are going to scale based on some other metric of the game. For instance, associating your IT costs to the population of the game will make sure that you’re taking into account more servers for more players.
You could also make content creation a variable cost, associated with overall revenue of the game. This would reflect an increased allocation of staffing to a successful game, trying to keep that hoop spinning down the street as fast as possible — while for a less successful game, you may cut down on content staff to recognize the lower ROI of those efforts. It really depends on your approach to resource allocation and where you set the bar on ‘success’.(Source: PlotLuck Games)
Financial Forecasting for Social Games
Brian Poel
Over the past several weeks, I’ve been developing a systematic approach to forecasting key financial metrics for social games. After outlining all of the variables, then working through the plausible ranges for these variables, I’ll now walk through the forecasting tool itself and how to use it before launch and after launch.
How to read the Spreadsheet Examples
I’ve inserted some screenshots of my forecasting spreadsheet in this blog post. The Blue cells represent data points. Their values have already been discussed in previous posts. The yellow cells are meant to be edited by you, the user of the spreadsheet. In particular, the “USE THIS” column are all of the variables that are actually grabbed by the parts of the spreadsheet that are doing all of the heavy lifting calculations. So the idea is to look over the range of variables in the blue cells, then either pick one value to input into the “USE THIS” yellow cell, or input your own custom variable, perhaps somewhere in between the blue variables or even something way outside the range if you just want to ‘see what happens’ to Annual Net Revenue or the Population curves.
Paid Customer Acquisition
Over there to the right is what the forecasting model looks like for Paid Customer Acquisition. The columns for Poor, Middling and Good, reflect the values discussed in Week 2′s blog post.
The section on Customers Purchased per Month has several yellow cells in the Low, Medium, High areas where you should provide your own budgetary ranges. There’s really no standardized ranges here, as it depends on what your budgetary capabilities are. Note: while the model calculates at a weekly level, I organized this by Monthly, since that’s likely how you’ve allocated your marketing budget.
The rows for Number of Customers take these budget values and apply them to the CPA values currently defined in the “USE THIS” column for that phase of game maturity.
“Free” Customer Acquisition
This section of the forecast covers your access to “Free” customers. As discussed in Week 2, if you’ve got multiple games in your portfolio, you can cross-promote to your existing audiences for free. If not, you may want to work with a service like Applifer , in order to get additional exposure without buying Facebook ads.
The numbers in the yellow cells are taken from the estimated impact from Applifer, but you should put in your own numbers here if you’ve got special access to customers on your own.
Attrition of Player Populations
This section of the forecast covers attrition rates of the different Player Populations. As discussed in Week 1, Attrition behavior will be very different soon after launch compared to several months into the maturity of your player base.
Note: I don’t apply a separate attrition rate to the One Week population. There’s one rate that takes New Players and transforms them into One Week Players, and then I start applying the same Retained Players attrition going forward. I could create more granularity here, but I don’t think it’s necessary. In earlier versions of the model, I had much more elaborate population curves, spread out over several weeks, but based on other research, I think populations settle into a Retained attrition behavior rather quickly.
Viral Customer Acquisition
This section of the model covers virality behavior of the different population pools. Notice that in the blue data cells, I’m using the final K factor and some assumptions on click-through rates, in order to back into the number of Invites. In the end, the K factor is all that’s used in the model (the yellow USE THIS cells), but you will want to track Invites and Conversion Rates so that you can improve those metrics in your game.
Player Spending
As discussed in Week 3, I decided to go with the ARPU * DAU % method of calculating spending. This category of variables is definitely one to track and update immediately in your forecast. By breaking your populations into individual weekly cohorts, you can start tracking trends in spending behavior as players spend more time with your game. You should also look for shifts in these variables as the game matures. New Player spending at launch may be more aggressive than New Spending four to six months into the game maturity. Also be careful with the New Player population at Maturity, as the Attrition rate is likely to be much higher, so you should downshift your ARPU expectations later on, when fewer of your New Players are likely to stick with the game. I don’t automate that adjustment here in these dashboard elements, because it was getting complicated enough as it was, but it’s certainly another level of refinement that I may look into.
Sensitivity Analysis
Once you’ve established which variable values are appropriate for your game, you can chart out sensitivity analyses for each variable, to see where the tipping point is between failure, ho-hum success, and rocket-to-the-moon success.
CPA at Launch:
Here’s an example of the sensitivity curve for the price of acquiring customers at launch. As you can see, there’s a point right around $0.25 that the Annual Net Revenue really starts to climb. This reflects a lot more customers being acquired at launch for the same defined budget.
Clearly, a lesson here is if you have a successful game at launch where other key metrics (retention, spending, etc.) are performing well, you want to take advantage of that window of opportunity by acquiring as many cheap customers as possible, until the ‘low hanging fruit’ isn’t so low anymore.
Attrition of Retained Players
This graph shows the effect of varying levels of attrition of the Retained Players population on Annual Net Revenue. As with the CPA chart, this is not a linear relationship. The tipping point looks like it’s happening around -10% attrition. Better attrition than that, and you have a very stable pool of retained players to monetize.
While Day 1 and Week 1 attrition are important early indicators of future success, the stability of your retained players tells you how leaky the bucket is long term.
Managing Forecasting over Time
Forecasting isn’t just for pre-launch planning. Once you’ve got real data, start plugging those into the spreadsheet into the specific weeks where that data applies, overwriting the formulas that had been calculating the forecast data. Now, your Past Weeks are feeding off of actual data, while your Future Weeks are still using your forecasting variables — and now your end of year goals, like total Net Revenue or end of year Player Population will be better informed and more accurate.
And, of course, take this opportunity to change your forecasting variables so that they are using the numbers that reflect where your game currently falls in the spectrum of Poor, Middling, and Good. It will be hard to be Good in all categories, but the forecast should reflect reality, not unrealistic optimism. Then you’ll be laser focussed on the real areas that need improvement. (Source: PlotLuck Games)


 闽公网安备35020302001549号