2016年(主要针对美国)手游趋势报道的8大看点
本文原作者:Joseph Kim 译者ciel chen
世嘉网络(世嘉的手游运营部门)与Sensor Tower合作出炉了2016年手游趋势报告。该报告涵盖了手游产业的总体以及手游类型的趋势。
主要看点1:三大热门游戏类型
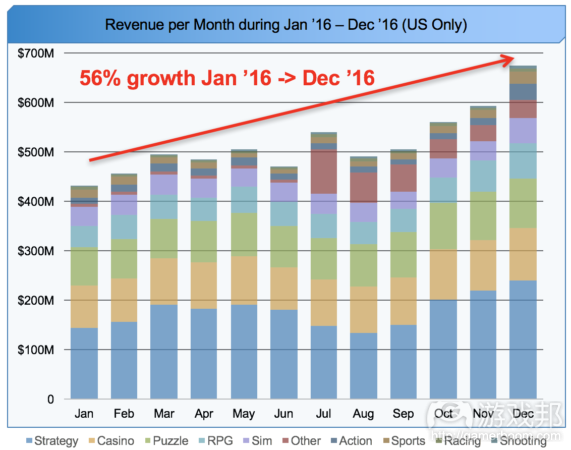
策略类(34%)、博彩类(18%)和解谜类(17%)为净收入占市场份额最多的前三类手游,它们分别对应下面柱状图的蓝色、黄色和绿色部分。
主要看点2:《精灵宝可梦》的影响力
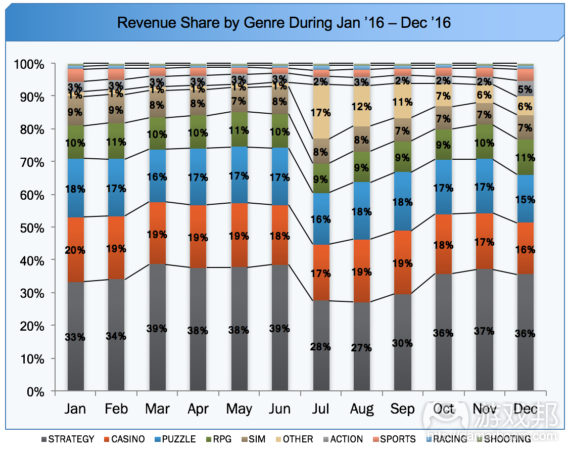
《精灵宝可梦》(属于其他类型手游)自2016年7月发行起,我们可以看到它从策略类手游(从39%跌至28%)那里偷走了相当大一部分的市场份额。不过,策略类手游的市场份额在年底又重新反弹(回到36%),而《精灵宝可梦》则从2016年七月至十二月经历了收益上相当大幅度的滑跌。
主要看点3:IOS vs. Google Play
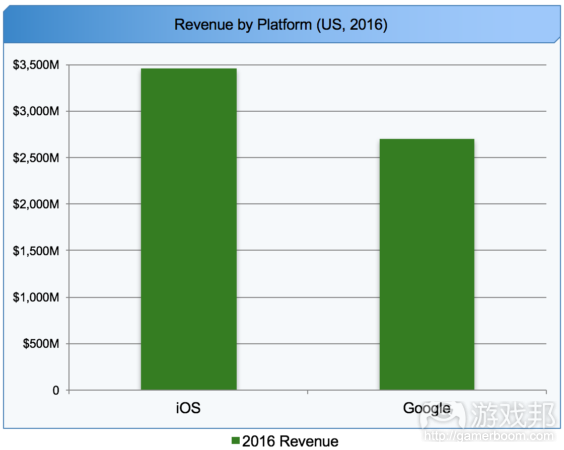
尽管IOS的市场占有率较低,但其所产生的IAP却占了大部分。根据数据统计公司Statista统计,IOS系统仅占全世界所安装操作系统的19%,而安卓系统则占了79%。不幸的是,我没能找到可以用的美国市场份额数值。IOS在净收入方面达到了35亿美元(56%),相比之下,Google Play净收入只有27亿美元(44%)。(这里要再次强调的是,这些数据挺适合我们研究手游的)
主要看点4: 2016年发行的十大热门游戏
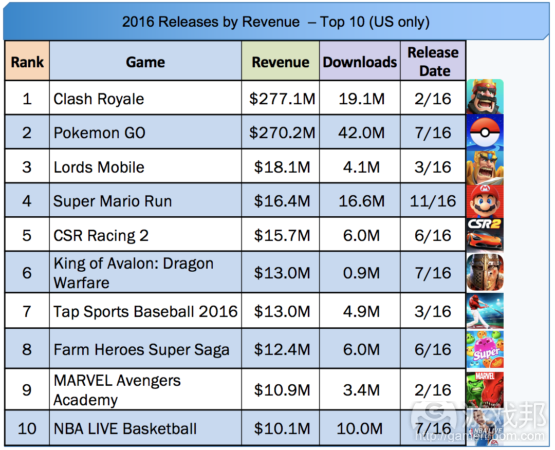
根据受益情况来看,《部落战争》、《精灵宝可梦》以及《王国纪元》是已发行手游中的前三名。《精灵宝可梦》的2016年下载量在这十大热门游戏中下载量总计中占37%。最后,十大热门游戏中有七款游戏是属于已批准IP或者已有IP的扩展游戏,这表明2016年品牌/IP对游戏的成功有重大意义。
主要看点5:MZ成为美国收入第一的发行商
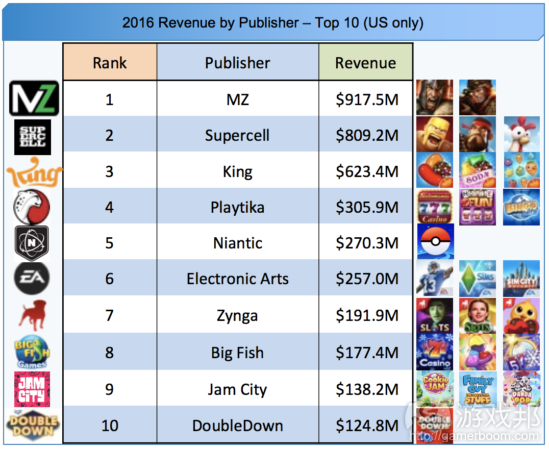
MZ荣升2016年收入排名第一的发行商,其成功主要依仗了《战争游戏》和《雷霆天下》(2015年年底发行的)的良好表现;而《战争游戏》也成为了美国市场热门游戏里收入最高的手游作品(2016年收入在美国市场达5.185亿美元)。
主要看点6:授权IP手游 vs. 原创IP手游
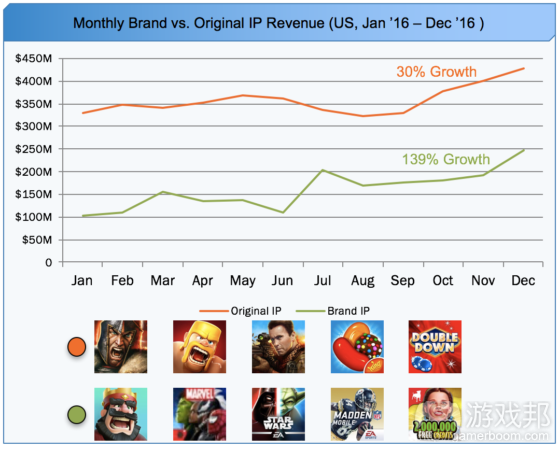
相比已授权的品牌IP手游(截止至12月16日为止占美国市场总收入的37%),原创IP手游(截止至12月16日为止占美国市场总收入的63%)在手游市场继续占据着主导地位。然而,品牌授权IP游戏的收入增长(增长了139%)要远超过原创IP游戏(增长了30%)。
主要看点7:AppStore收益集中程度
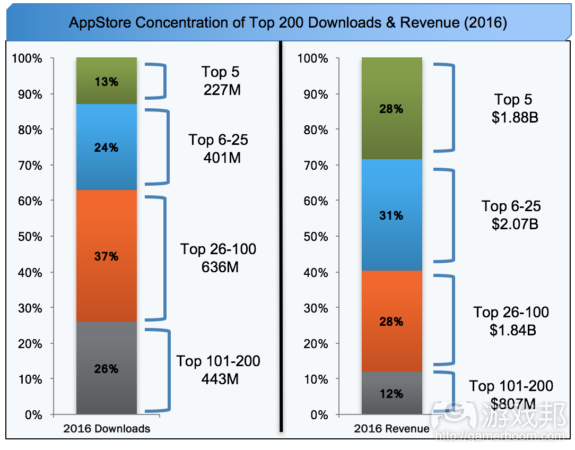
美国2016年度200款热门手游创造了大概66亿的年收入。200款热门手游中,排名前五的5款游戏下载量占比13%,但其收益占比却达到28%。
主要看点8:不同排名游戏的月收入差别
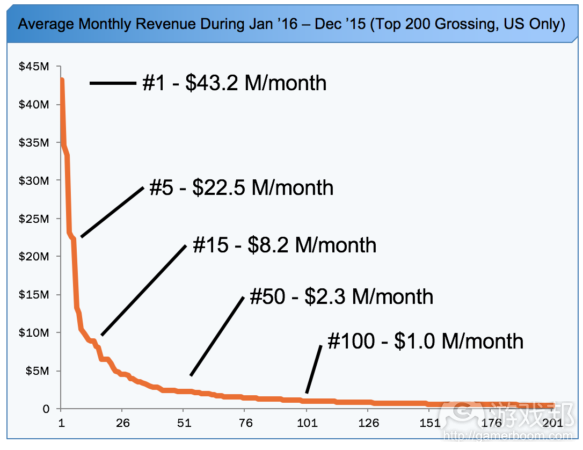
跟收入排名100游戏比起来(平均每月净利润仅为100万美元左右),收入排名第一的游戏在2016年创下平均每月约为4320万美元的净利润。
该报告还进一步对每个类型及子类型的手游进行分解以分析其趋势;此外还记录了各个手游类型中热门的作品。
本文由游戏邦编译,转载请注明来源,或咨询微信zhengjintiao
SEGA Networks (mobile operating division of SEGA) partnered with Sensor Tower this year to present the 2016 Mobile Gaming Trends Report. The report covers the overall and category-focused mobile gaming industry trends.
You can access the full report contents for free from the website here: www.mobilegamingtrends.com.
This post covers some of the key take-aways from the 2016 Mobile Gaming Trends report. The analysis was conducted by studying the universe of mobile games in 2016 that generated at least $250K in net IAP revenue in a single calendar month on both iOS and Google Play. We further segmented the games into categories based on a mobile gaming industry taxonomy which I posted about here: An Open-Source Mobile Gaming Taxonomy.
Key Take-away #1: Top 3 Categories
Strategy (34%), Casino (18%), and Puzzle (17%) comprised the top 3 mobile gaming categories by market share based on net revenue. See blue yellow and green categories below.
Key Take-away #2: Impact of Pokemon GO
The launch of Pokemon GO (in the Other category) saw the game steal significant market share from the Strategy category (drop from 39% to 28%) when it launched in July of 2016. However, strategy recovered by the end of the year (up to 36%) and Pokemon GO saw a fairly sharp decline in revenue from July through December of 2016.
Key Take-away #3: iOS vs. Google Play
iOS generated the majority of IAP revenue despite having much less market share. Statista reports that iOS only held 19% share of worldwide mobile OS installed base compared to Android with 79% share. Unfortunately, I did not find good U.S. market share numbers. iOS accounted for $3.5B (56%) in net revenue compared with $2.7B (44%) for Google Play (again, for mobile games that qualified for our study).
Key Take-away #4: Top 10 Releases for 2016
Clash Royale, Pokemon GO, and Lords Mobile comprised the top 3 mobile game launches of 2016 by revenue. Pokemon GO accounted for 37% of the downloads of all of the Top 10 for 2016. Finally, 7 of the top 10 games were either Licensed IP or Expansion Game IPs showing the importance of brand/IP to game success in that year.
Key Take-away #5: MZ Became #1 US Publisher
MZ became the #1 US mobile game publisher in 2016. Both Game of War and Mobile Strike (released in late 2015) contributed to MZ’s success. Further, Game of War became the #1 grossing game (generating $518.5M in 2016 US revenue).
Key Take-away #6: License vs. Original IP
Original IP games (63% of total revenue in Dec ‘16) continue to dominate the mobile gaming market relative to Branded IP based games (37% in Dec ’16). However, Branded IP games (139% growth) are growing much more strongly than Original IP based games (30% growth).
Key Take-away #7: AppStore Concentration
The Top 200 grossing titles for 2016 in the US generated an estimated $6.6B of revenue in 2016. The top 5 Titles represented a full 28% of revenue amongst the top 200 despite only comprising 13% of the downloads.
Key Take-away #8: Monthly Revenue by Chart Position
The #1 game in the U.S., made an estimated average of $43.2M / Mo. in net revenue in 2016 (U.S. only) compared to only $1.0M / Mo. for the #100 spot.
This report further breaks down each mobile gaming category and sub-category for trends. The top games in each category are also noted.
The categories were defined as below:(source:gamasutra.com )






 闽公网安备35020302001549号