开发者不可不知的KPI概念及用法
作者:Nathan Lovato
作为独立游戏设计师,我们通常只专注于创造游戏。销售和营销相关的领域在我们看来无异于天书。但为了生存,我们有时候必须要有经营公司的思维。我们知道如何制作游戏之后,就必须掌握推广和销售游戏的方法。在这个每天都有成百上千款应用发布的市场上,我们无法仅仅依靠游戏质量来吸引用户。
美国App Store每个月都有1.2万款游戏发布,每个平台每天超过400款新游戏面世。虽然它们质量有差别,但这种激烈的竞争形势下,人人都很难获得足够的曝光度。更重要的是,作为一个团队,我们希望尽量不要寄希望于运气,因为这意味着我们自己和团队成员都会有风险。
作为一家公司,我们可以利用一些客观工具来查看自己的项目运营表现。我们可以评估自己作品的风险,以及一家游戏公司要生存下去所需达到的具体目标。这些工具合称关键绩效指标,简称KPI。
什么是关键绩效指标?
KPI是用于衡量游戏、产品或者公司整体表现的参数。
KPI的作用如下:
*帮助你评估游戏或公司是否成功
*让你广泛了解项目当前的状况
*为你呈现迈向关键目标的进度
绩效指标是对特定目标的量化,它与公司的项目或活动有关。KPI的简单定义就是:“它是有助于你了解自己同目标之间差距的一种参数。”——Avinash Kaishik.
Avinash Kaishik还以一种有趣的方式说明了你应该实现的目标,“目标必须具有DUMB特点,即可行(Doable)、可理解(Understandable)、可管理(Manageable)以及有利(Beneficial)”。
需要注意的是,KPI并不等同于一些营销概念。它们是你整个团队都要使用的指标。这些参数通常很广泛并且易于理解。
例如,你的下一款游戏可能要瞄准新玩家。在游戏发布之前的一个KPI就是社交网络上的注册用户增长率。作为一家公司,你可能想通过增加收益来创造更多更大的游戏。这样你就必须追踪每周的新用户数量,以及每个用户在产品中的平均投入这两个KPI。这些是你公司中的每个成员都能理解的数据。
而对于游戏本身来讲,你的KPI多数时候要取决于用户分析。
GameAnalytics调研团队分析了超过400款游戏的留存率、转化率和收益相关的参数。他们的调查结果让我们对游戏收益成功指标有了更为清楚的认识:
1.游戏未来是否成功可以在发布之前进行衡量。
2.顶级游戏表现出色的两个指标分别是:留存率和转化率。如果你的游戏含有IAP选项,那么ARPPU(每付费用户平均收益)也是一个关键指标。
3.初期群组,即你的首批玩家也可能决定游戏的成败。
这些都是易于追踪的高级KPI。我将在下文列出一些与多数游戏项目相关的普遍参数。
游戏开发者的高级KPI
让我们从上文提到的两个关键参数入手:留存率和转化率。
你的留存率即在第1天,第2天,第3天……之后重返游戏的用户比例。它有多种计算方式,但Game Analytics使用的是最典型的方法,它对于衡量长期留存率尤为有效。
转化率,即在游戏中花钱的玩家比例。这可以是从你的游戏demo或精简版应用中购买完整版本的用户,也可以是购买F2P游戏道具的玩家。你可以通过计算游戏中每件付费道具的转化率,找到销量最佳的商品。
另一个极为常用的参数是流失率。它就是留存率的反义词,即不再玩游戏的用户比例。留存率+流失率=100%。
还有MAU和DAU这两个最简单的KPI概念。它们分别指月活跃用户和日活跃用户。这两个常用参数可以让你持续追踪用户基数。好游戏一般都有较高而稳定的DAU。
还有每日新用户和每周新用户这两个概念。你可以由此得知生周有多少人安装游戏,以及这个数值的发展情况。如果你通过自然渠道获得了越来越多新日常用户,这意味着你的游戏运营良好。
还有一个可以让你判断玩家在游戏中是否拥有愉快体验的直观参数:每用户平均会话长度。会话长度的分布也很关键。例如,观察哪些游戏环节会话长度低于5分钟,哪些环节会话长度超过5分钟。换句话说,也就是监测在游戏中长期逗留的玩家比例,以及快速离开游戏的玩家比例。
F2P游戏特征
实际上,如果你制作的是单次付费模式游戏,就没必须追踪太多KPI。追踪单次付费模式游戏的利润很简单,这是一个相当直观的过程:因为每个付费用户在游戏中的消费额都一样。这类游戏有可能不再需要任何运营成本。当你的总收益超过预算时,游戏就已经实现利润。
而F2P游戏却需要源源不断的用户从中花钱。制作F2P游戏的工作室通常要投入一些广告成本以便持续获取新用户。所以每位下载了游戏的用户至少都有一些实际成本,即所谓的CPI(每安装成本)。
CPI可同其他参数一起用来监测项目运营是否成功,即查看用户的LTV(终身价值)。这就要比较你获得一名用户所投入的成本,以及该用户在游戏中的消费额。我们用这些数值来计算游戏投资回报率(ROI)。ROI=LTV-CPI。如果这个数值为负,那就意味着你是在亏本运营游戏。
ARPU(每用户平均收益)以及ARPPU(每付费用户平均收益,注意是“付费用户”)是与F2P游戏相关的两个最常用盈利参数。它们都是衡量每名用户利润性的关键指标。注意,ARPPU必须一直高于ARPU。我们有时候也会观察ARPDAU,即每日活跃用户平均收益。
提到日活跃用户,就会涉及到另一个关于用户粘性分析的参数,也就是所谓的粘性系数。粘性系数计算方法就是将日活跃用户除以月活跃用户:粘性系数=DAU/MAU。粘性系数为0.1或10%则意味着每名开始玩游戏的新用户,都有10%转化为日常用户的可能性。你的日常用户将成为最可能在游戏中消费的群体。
游戏开发者应该追踪多少项KPI?
我们不可耗费过多时间追踪KPI。如果它们是很棒的工具,就不会转移我们专注于制作好游戏这个重心(因为这是游戏工作室获得成功的最保险途径),也不会阻碍我们与玩家的互动。
所以没有必要追踪过多项KPI!只要追踪几项具有重要的KPI就足以让我们了解自己与既定目标之间的距离。虽然KPI可以让你更深入洞察项目运营情况,你还是没有必要在这一点上投入过多时间。也许你想筛选出与特定目标最有关系的参数,还想确定追踪这些参数的频率。
你可以使用Game Analytics这种可以替你追踪参数的工具。你只需每天或每周来观察一次,看看自己参数的发展情况。Google分析工具也可以让你了解自己网站的表现情况。今天的社交网站也可以为你提供详细的分析结果。所以你没有必要亲自追踪过多数据。
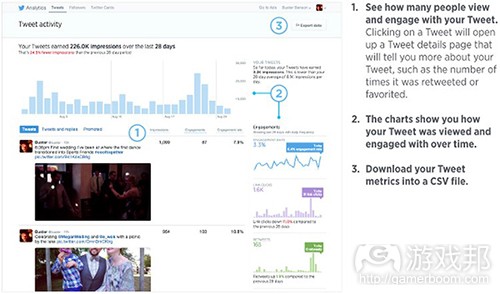
(Twitter与Facebook和Youtube一样,可以提供关于你推文的详细分析。其中有些参数也可以视为绩效指标)
如何有效运用KPI
正如上文所述,你选择观察的参数必须是那些与你项目相关的KPI。所以我们在此仅列出一些助你选择正确KPI的一些简单步骤。
要有效运用KPI你就必须:
1.找到你游戏或公司的期望目标。例如让网站流量在6个月内翻倍。
2.分解你实现该目标的步骤。你该如何优化开发博客?是否要开始每周视频更新?
3.列出你必须监测的数据来追踪你实现该目标的进程。你的用户上网搜索哪些关键字?你发布在社交网站上的每篇文章反响如何?
4.核实自己的战略:以固定频率观察每个数据流的发展情况。每个参数是否都具有关联性?要果断放弃那些过剩的参数,或者添加其他有用的参数。
总结
KPI并不复杂。如果你一直在制作特定类型的游戏,你可能就会反复使用相同的指标。
你只需要记住以下一些关于KPI的情况:
*它们有助于你监测自己迈向DUMB目标的进度。
*它们应该足够简单以便大家都能理解。(本文由游戏邦编译,转载请注明来源,或咨询微信zhengjintiao)
Everything you need to know about interpreting KPIs
by Nathan Lovato
As independent game designers, we generally want to focus our mind on game creation. Sales and marketing related domains often feel foreign to us. Yet, to make a living, we do have to think as a company sometimes. Once we know how to make games, we have to learn how to market and sell them. On a market where 100s of titles are released each day, we cannot just rely on our games’ quality to magically attract users.
There are 12,000 games released on the US apple store each month. More than 400 each day on a single platform. Although they are of varying quality, the concurrence is fierce and it is hard to get visibility. More important even, is the fact that as a team, we want to rely on luck as little as possible: the risk isn’t only on our shoulders, but also on our teammates’.
As a business, we have some objective tools at our disposal to see where we are going. We can estimate the risk our work represents, and the precise objectives we have to reach in order to survive as a game company. Those tools are collectively called Key Performance Indicators, or KPIs.
What are key performance indicators?
KPIs are metrics that are used to measure the performance of your games, your products, or your company as a whole.
KPIs are metrics that:
Help you to evaluate the success of your game or your company.
Give you a broad understanding of your business’s current position.
Show your progress towards key goals.
Performance Indicators are quantifiable and relevant to a specific goal and relate to a project or an activity in your company. To put things in simpler terms, here is a clear, simple definition of a Key Performance Indicator: it is “a metric that helps you understand how you are doing against your objectives.” – Avinash Kaishik.
The same author exposes the goals you should be looking to achieve in an interesting way. He says that “The objectives must be DUMB: Doable. Understandable. Manageable. Beneficial.”
It is important to note that KPIs are not some kind of shady marketing concept. They are indicators that your whole team will use. Those metrics are often broad and easy to understand.
For example, you may be looking to target new players with your next game. Before the game is released, one key performance indicator would be your subscriber count’s growth on social networks. As a company, you may want to increase your revenue to create bigger and better games. 2 KPIs to track in that case could be the amount of new weekly customers and how much each customer spends on your products on average. Those are streams of data each employee in your company can understand.
When it comes to your games themselves, your KPIs will most of the time boil down to your User Analytics.
The research team here at GameAnalytics analyzed more than four hundreds games’ retention, conversion and revenue related metrics. Their study gives us a few interesting pointers as far as a game’s financial success is concerned:
The future success of a game can be measured before its release.
There are 2 metrics top-tier games show excellent results with: retention and conversion. ARPPU (Average Revenue Per Paying Users) is also meaningful whenever your game features In App Purchases.
The Golden Cohort, that is to say your first players, can make or break the success of your game.
Those are easy to track, high-level KPIs. Below, I try to compile a list of some general metrics that can be relevant for most game projects.
High level Key Performance Indicators for Game Developers
Let’s start with the 2 key metrics mentioned above: retention, and conversion. Your retention corresponds to the percentage of users who came back to your game after 1 day, 2 days, 3 days… It can be calculated in multiple ways, but Game Analytics uses the classic method, which is pretty telling as far as your long-term retention is concerned.
Game Analytics offers an easy access to all of the most common high-level metrics.
Conversion, on the other hand, simply is the proportion of players who invest money into your game. This can be users who buy your full game from your demo or lite app version, all simply players who buy an in game object in the case of the free To Play title. That is a metric that can be used at different levels into your games are applications. You can calculate the conversion rate for each paid item in your game to see which ones sell the best.
Another very common metric is the churn. It is the opposite of your retention: the churn of an app corresponds to the proportion of players who stop playing altogether. Retention + Churn = 100%.
Among the simplest KPIs, we also have MAU and DAU. Respectively Monthly and Daily Active Users. Those 2 are general metrics that permit you to keep track your user base over time. A high and steady DAU characterizes a healthy game.
Along the same lines falls the amount of new daily or weekly users. It is always interesting to know how many people are installing the game every week, and to see how this value evolves. Once again, if you’re gaining more and more new organic daily users, it means that your game is pretty healthy.
There is another straightforward metric that can give you an idea of how pleasant your game is: the Average Session Length per User. The distribution of your session length can also be useful. That is to say observing what proportion of game sessions last less than 5 minutes for example, and how many last for more than 5 minutes. In other words, it is interesting to monitor the proportion of users who play for a long time compared to those who leave the game pretty fast.
The specifics of Free to Play games
In practice, you will rarely need to track many KPIs if you make single-payer games. In particular, tracking the profits made by a single-payer game is a straightforward process: each person who buys the game spends the same amount of money. Chances are the game won’t have any operating cost. Once your gross revenue outweighs your game’s budget, it is profitable.
Free to play titles, on the other hand, require a constant stream of users to spend money while playing to be profitable. Studios which make Free to Play games often have to invest a certain amount of money in ads in order to keep reaching new users. So each person who downloads the game has at least a virtual cost called CPI (cost per install).
The CPI can be used in conjunction with another metric to monitor the financial success of your projects: the LTV (lifetime value). That is comparing how much money it cost you to get a user to install your game and how much they spent on it and return. We use those values to calculate the Return on Investment of a game: ROI = LTV – CPI. If this value falls down in the negatives, it means that you are keeping the game alive at a loss.
ARPU (Average Revenue per User) and ARPPU (Average Revenue per Paying User, note the 2 “P”) are the 2 most common revenue related metrics for Free to Play titles. They are both key indicators of your profitability per user. Note that ARPPU will always be higher than ARPU. We also sometimes look into ARPDAU: the Average Revenue per Daily Active User.
Speaking of daily active users, there is another useful metric that pushes the analysis of users sticking to your application: what we call the Sticky Factor. The Sticky Factor is calculated by dividing the Daily Active Users by the Monthly Active Users: Sticky Factor = DAU/MAU. A sticky factor of 0.1 or 10% means that for each new player that starts playing your game, you have 10% chance to turn him into a daily user. And your daily users will be the ones who will most likely spend money on your game.
How many KPIs should we track as game developers?
It is key to not spend too much time focusing on Performance Indicators. If they are a great tool, they shouldn’t distract us from creating good games (which is the safest way to be successful as a game studio). And from keeping in touch with our players.
It isn’t necessary to track many! A few relevant metrics are enough to get a good sense of your progress towards any given objective. And although KPIs will give you solid insights about your business, you shouldn’t spend too much time tracking them. For one, you want to filter the metrics that are the most relevant to your specific goals. But you also want to define the frequency at which you are going to get updates on them.
Thankfully, when it comes to games, a tool like Game Analytics takes care of the tracking for you. You will just have to come every day or one time a week to check the evolution of your statistics. Google analytics will give you lots of insights on your website. And social networks also offer detailed analytics nowadays. So you don’t have to keep tracking too much data by yourself, even aside from your game’s user analytics.
Twitter, just like facebook and Youtube, offers detailed analytics on your tweets. Some of those metrics can be tracked as Performance Indicators.
How to properly use Key Performance Indicators
Until now, we talked a bit about what’s KPIs are, and took a look at a few common high-level metrics. As I told you before, the performance indicators you decide to pick should be specific for each of your projects. So instead of telling you which ones you should use here are some simple steps you can take to pick the right Performance Indicators for your project.
To properly use KPIs you need to:
Find a desired objective for your game or business. I.e. doubling your website’s traffic over 6 months.
Dissect the steps you need to take to reach that goal. How could you improve your development blog? Should you start making weekly video updates?
List the data you need to monitor to track your progress towards that goal. What keywords do your users search for online? How well does each of your article spread on social networks?
Keep your strategy on check: come back to and observe the evolution of each stream of data at a fixed frequency. Was every metric relevant in the end? Don’t hesitate to take out the ones that proved superfluous or to add other ones.
Summary
As you have certainly noticed, Key Performance Indicators are pretty simple. If you keep making a specific genre of games, chances are you will end up reusing the same indicators again and again.
If you should only remember a few things about KPIs:
They help you to monitor your progress towards DUMB objectives (“Doable. Understandable. Manageable. Beneficial.”)
They should be simple enough so that everyone can understand them(source:gamasutra)
上一篇:应用标题及描述不可滥用关键字
下一篇:如何有效应对一款糟糕的游戏


 闽公网安备35020302001549号