针对不同玩家群组分析游戏运营表现
作者:Allison Bilas
我们在上一篇文章中分析了400多款游戏发布90天后关键参数的表现情况。
我们的一个发现就是多数成功游戏都有较好的初始安装量,我们认为有必要对此深入挖掘。
分析方法
样本描述
我们查看了2014年实现1000次安装量的208款游戏的玩家情况。我们分析的是在这些样本中收益表现最成功的游戏(即分位数在50%以上的游戏),但考虑到我们执行分析的工具可能存在误差等原因,这里排除了一些存在异常值的游戏。
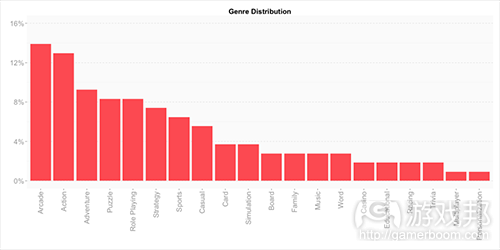
以下图表显示了这些游戏题材的分布情况(基于游戏在App Store的分类情况)。
用户群组描述
为确定之前所观察到的差异源于何处,我们分析观察了两个用户群组:
*群组1:游戏发布首周(或达到1000次安装量)就进行安装的用户
*群组2:游戏发布90天/达到1000次安装量当周进行安装的用户
以下结果基于每个群组的中间值计算,以便观察两个不同群组在头12周的不同参数表现。
参数
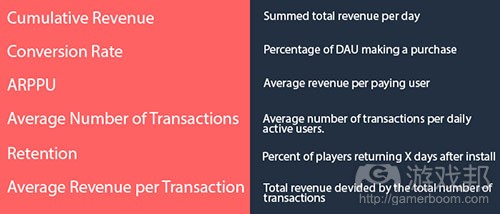
以下图表描述了我们所考虑和分析的参数:
结果
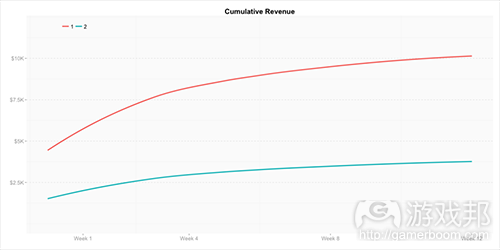
我们从查看两个玩家群组的累计收益入手。群组1的玩家比群组2多30%,因此图表上所显示的数据差距并不令人意外。
有趣的是群组1在此呈现了陡峭的曲线。乍一看图表似乎比数据更有说服力。这能看出群组1的累计收益为何增长更快吗?
这其中的差距究竟在哪里?
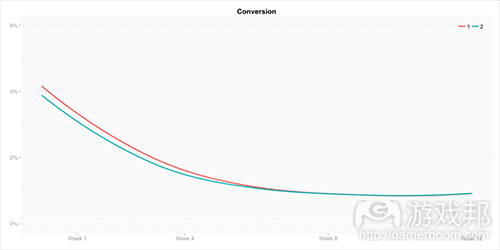
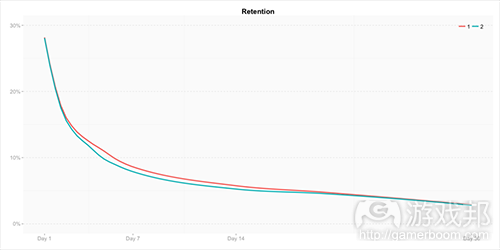
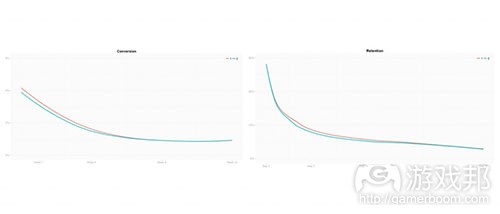
显然我们要去查看的参数是留存率和转化率。在以下图表中,这两者的留存率似乎差别不大,但它却能够影响群组的收益。因此,这种微小的差距影响可能十分深远。
让我们粗略计算一下:同样是1万DAU,0.4%左右的转化率差距意味着每天多400个付费用户。如果每个付费用户消费10美元,30天后就意味着该群组收益增加12万美元。
群组1的转化率刚开始高于群组2,之后与群组2持平,但这两组的留存率基本相当。
留存率和转化率也不能完全回答我们的问题,我们只能继续深入挖掘。也许ARPPU图表存在答案:
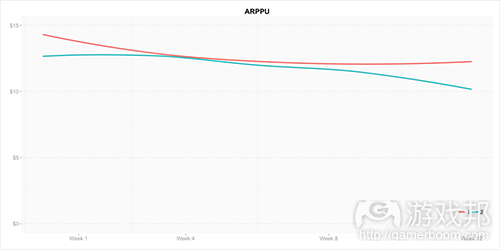
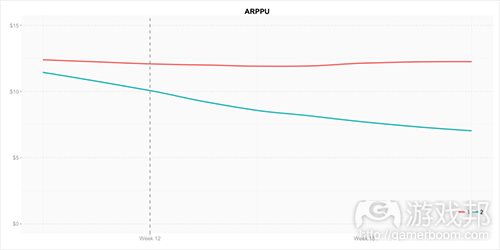
群组1的ARPPU不但起点更高,而且之后的发展也更为稳定。以下图表是我们对这2个群组在游戏发布头12周的ARPPU值的预测:
群组2的ARPPU在第4周之后就开始衰落,而群组1的ARPPU在12周之后几乎还是保持了原来的水平。
所以,群组1付费玩家的消费水平比之后的用户更高,为什么?
这个查看每DAU平均交易次数的图表显示,群组1付费玩家消费频率远高于后来者。
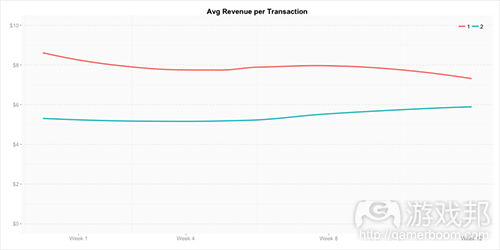
不仅如此,这一群组的玩家每笔交易额似乎也高于后来者。
我们的样本显示这两个群组最初平均每笔交易额存在4美元的差距,在头12周趋于尾声时这种差值才“正常化”为1.5美元左右。
总结
从累计收益图表入手,我们研究了游戏首批玩家与后来者之间的差异。
结果表明游戏的首批玩家有可能:
*执行更多笔交易
*更有可能购买昂贵的道具
这是两个群组所存在的主要差异。
但我们仍然无法解答为何他们会在游戏中投入更多金钱。虽然我们也查看了游戏会话长度,会话频率等其他参数,仍然无法找到答案。
这次分析让我们得到另一个发现,我们仍然认为以下两个图表比数据更有说服力:
这两个群组的这两个参数几乎趋向一致,我们认为这一点足以说明游戏设计的重要性。游戏并不仅局限于数据。游戏设计与数据和分析一样,都是用于提升丰富而有趣的玩家体验所采用的手段。(本文由游戏邦编译,转载请注明来源,或咨询微信zhengjintiao)
Exploring The Golden Cohort
by Allison Bilas
player-cohorts
In our last data science report on what makes a game successful we looked at the evolution of key game metrics over 90 days after launch, across 400+ games. (If you haven’t read that already, we definitely think you should before going forward with this one.)
One of our findings was that most successful games show a better handling of their initial installs, dubbed the Golden Cohort. We thought it would be an interesting venture to dig a bit deeper into this. And so the queries began.
Methodology
Sample description
We look at players from 208 games that hit 1000 installs during 2014. They represent the games that on a cumulative revenue basis are in between the 50th and the 90th percentile. This ensures we analyse the most successful games in terms of revenue in our network (games that pertain to the percentiles above the 50th), but without including outliers, which might occur due to wrongful implementation of our tool or heavy tests performed by developers (above the 90th percentile).
The data is smoothed to capture the important patterns and leave out irrelevant noise.
To get a picture of the type of games the sample is comprised of, the chart below presents its genre distribution (based on the games’ App Store category submission).
Sample genre distribution
The sample’s genre distribution
Cohort description
To determine where the previously observed difference in performance comes from, we’ve based our analysis on examining two cohorts:
Cohort 1 – made up by the users that installed during the week in which the game launched (or reached 1000 installs) – the Golden Cohort;
Cohort 2 – representing the users acquired in the week 90 days after launch/achieving 1000 installs.
The following results are based on median calculations per cohort, in order to observe the evolution during the first 12 weeks of different metrics, for each of the two cohorts.
Metrics
The table below details the metrics we have considered and analysed.
The metricsThe metrics
Results
We started by looking at cumulative revenue across the two cohorts of players. As Cohort 1 has 30% more players, the difference in numbers shown by the chart below isn’t surprising.
Cumulative revenue for the Golden Cohort as opposed to Cohort 2
What’s interesting here is the steep curve of Cohort 1. In this case, the “look” of the chart says more than the numbers themselves. See how cumulative revenue increases faster for Cohort 1?
So, where does this difference reside?
Conversion and retention seemed to be the obvious choice of metrics to check. In the chart below conversion seems to show only a slight difference, but its effect on revenue depends on the cohort size. Therefore, this small difference can become significant.
A small difference can go a long way
Let’s make a rough calculation: for 100K DAU, an approximately 0.4% difference in conversion means 400 more monetizers per day. If these were to spend 10$ each, after 30 days, that would mean an increase in revenue of 120000$ for the Golden Cohort.
Retention follows almost the same pattern for both cohorts
While conversion starts slightly higher for the Golden Cohort before it falls into the same values as Cohort 2, retention follows almost the same pattern for both cohorts.
As conversion and retention didn’t seem to fully answer our question, we drilled deeper. Average revenue per paying user seemed to hold the answer:
ARPPU not only starts higher, but maintains better over time. Take a look at what we predict the ARPPU will look like for these two cohorts after the first 12 weeks:
Predicated ARPPU for the next month and a half
6 weeks ARPPU prediction
For Cohort 2 ARPPU starts decaying immediately after week 4, while the Golden Cohort’s ARPPU will maintain almost at the same level throughout time, both before and after week 12.
So, your Golden Cohort spenders spend more than your later adopters. But how?
Taking a look at the average number of transactions per DAU clearly shows that the Golden Cohort purchases more frequently than later adopters.
Not only that, but the Golden Cohort seems to also pay more per transaction.
Our sample shows a difference of 4$ in average revenue per transaction between the two cohorts in the beginning, difference that “normalizes” to around 1.5$ towards the end of the first 12 weeks.
Conclusion
Starting from the cumulative revenue chart, we’ve investigated where the difference between the Golden Cohort and a later one comes from.
The results have shown that your Golden Cohort players will:
spend more in terms of frequency of transactions;
be prone to spending on the more expensive items in the store.
These points are the major differences in behaviour that we were able to identify between the two cohorts.
The question as to why they pay more remains unanswered. Though we looked at other metrics that might unravel this – such as session length, sessions frequency, etc. – the results were inconclusive, as those metrics can be very tightly linked to the game’s genre. May it be that this behaviour is typical to what Everett Rogers refers to as early adopters? What does your experience tell you?
Our journey brought us to another realisation. As little as the conversion and retention charts told us for the question at hand, we still think the two graphs are beautiful for what they convey beyond the numbers. Let’s look at them again:
See how the patterns for these metrics fall in line for both cohorts, leaving close to no difference between the Golden Cohort and a later later one? We think this stands for how important game design is. And find it thrilling, if not poetic, to have the numbers reflect how important creativity, gut feeling, that-certain-something, or whatever you want to call it is. After all, games are not numbers. As important as numbers and analysis are, they are only a resort for improving what games are all about: rich, fun player experiences.(source:gamasutra)
上一篇:如何阻止一款手机应用遭遇失败





 闽公网安备35020302001549号