


手机游戏的游戏玩法与IAP的标准参数(一)
作者:Andy Savage
在过去几周时间里我发布了一些关于优化游戏玩法和用户转换的分析案例。我将使用一款现实游戏作为例子,即App Store中的《Ancient Blocks》。
本文中的报告使用了Calq,你也可以使用其它服务或自己创造这些参数。比起“如何测量”,这系列文章将更注重“测量什么”。
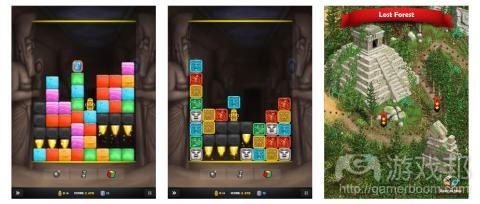
ancient blocks(from gamedev)
常见的KPI
通常情况下,不管是什么类型,所有手机游戏的高级关键绩效指标都是相似的。大多数开发者所拥有的KPI包括:
第一天,第七天以及第三十天的用户留存—-用户多长时间回到游戏中一次。
DAU,WAU和MAU—-每日,每周以及每月的活跃用户,这是衡量活跃玩家基础的数值。
用户LTV—-这是关于玩家的终身价值(通常情况下是基于各种年龄层,性别,地理位置,广告活动等等进行衡量)。
DARPU—-每用户每日平均收入,也就是每天每个活跃用户所创造的收益。
ARPPU—-每付费用户平均收益,这是与LTV相关的测量,但它只计算真正付费的用户子集。
除此之外还存在一些特定的KPI。这些参数将帮助你明确游戏的独立组成部分并对其进行更好的完善。你的最终目标便是通过完善更多游戏领域而提高高级KPI。
用户留存
用户留存是衡量用户在一定时期后回到游戏中的频率。第一天的用户留存是关于多少玩家在第一次游戏后的隔天回到游戏中,第七天用户留存是指七天后回到游戏中的玩家。用户留存是关于游戏是否具有粘性的关键指标。
通常情况下衡量用户留存比衡量收益还重要。如果你拥有很棒的用户留存但是用户终身价值却不怎样,那么你便可以在之后做出进一步的改善。而如果是相反情况的话你可能就会措手不及。如果基于较低的用户留存率,你便更难从一款应用中获得盈利。
用户留存表格是观察一段时期后游戏留存率的有效方法:
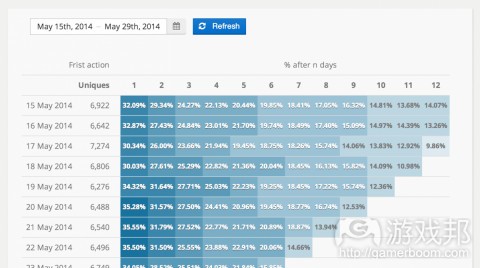
retention grid(from gamedev)
当游戏是基于用户留存进行迭代(游戏邦注:添加/删除一些功能或调整现有的功能),我们便能够看出一些改变是否具有正面的影响。
活跃的用户基础
你可能已经听过“每日/每周/每月”活跃用户。这是关于你的活跃用户基础的产业标准尺度。例如WAU是衡量过去7天里玩游戏的特定玩家数量。使用DAU/WAU/MAU是明确你的用户是增长,收缩还是平稳的简单方法。
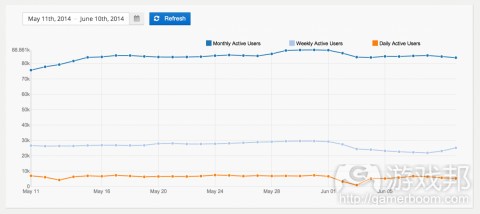
active user base(from gamedev)
活跃用户衡量需要与用户留存数据一起进行分析。如果你拥有许多新用户但同时也失去了一些现有的用户,那么你的用户基础可能会趋于平稳。
游戏特定的KPI
除了常见的KPI,每一款游戏还具有特定的额外参数。这可能包含你的玩家在游戏中的进程的相关数据(如级别),游戏机制,平衡参数,病毒性传播以及分享循环等等。
这将衡量大多数用户进程(用户参与你的应用的互动路径,如开始一次新游戏的菜单),如此开发者便能够对其进行迭代与优化。
《Ancient Blocks》的特定参数包含:
玩家进程:
完成了哪些关卡。
玩家是否重新玩了一个更高的难度。
关卡难度:
玩家完成一个关卡前做出了多少次尝试。
玩家在一个关卡中花费了多少时间。
玩家在完成一个关卡前使用了多少道具。
游戏内部货币:
玩家在游戏货币中花了多少钱?
玩家用游戏货币换取了什么?
玩家在购买前通常或做些什么?
游戏内部教程
当玩家第一次开始玩一款游戏时,他们通常会看到一个教授他们如何玩游戏的互动教程。这是游戏留给玩家的第一印象,所以开发者需要好好完善教程。如果你的教程很糟糕,那么你的第一天用户留存也会很糟糕。
《Ancient Blocks》拥有基于10个步骤的教程去教授用户如何游戏(垂直拖动组块直至它们能够连成一条线)。
目标
关于教程的数据需要呈现出哪些领域需要进行完善的信息。通常情况下这些都是用户容易受困或花太长时间的领域。
识别教程中的阻塞点(即用户受困的地方)。
迭代这些教程步骤将能够提高游戏的用户转换率。
参数
为了完善教程,你就需要明确一组针对于教程的参数。对于《Ancient Blocks》,我们需要获得的关键参数是:
通过每个教程步骤的玩家比例。
在完成教程后继续游戏的玩家比例。
执行
使用基于行动的分析平台(就像我们使用了Calq)追踪教程步骤非常直接。《Ancient Blocks》便使用了名为教程步骤的行动。这一行动包含名为步骤的定制属性去指示用户处于哪个教程步骤(0代表第一步)。我们同时也想要追踪用户花费在每个步骤的时间长度(按秒计算)。为了做到这点我们包含了一个名为持续时间的属性。
行动
属性
教程步骤
步骤—-当前教程步骤(0代表开始,以此类推)。
持续时间—-用户完成步骤所用时间(按秒计算)。
分析
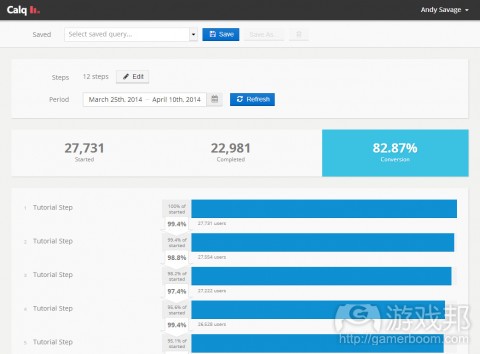
分析教程数据非常简单。我们可以通过创造一个简单的转换漏斗(每个漏斗步骤就等于每个教程阶段)去识别大多数参数。
完整的漏斗查询能够一步步地呈现完整的教程交换率。在这里我们很容易看到哪个教程“损失”了最多用户。
funnel(from gamedev)
从结果中我们可以看到:第四个步骤拥有大约97%的转换率而其它步骤拥有99%的转换率。这表明我们需要完善这一步骤。尽管只有1%的差别,这却代表着我们在这一步骤中每个月可能损失1000美元的收益。而如果是一款大受欢迎的游戏,其损失可能会更大!
(本文为游戏邦/gamerboom.com编译,拒绝任何不保留版权的转功,如需转载请联系:游戏邦)
Standard Gameplay and IAP Metrics for Mobile Games
By Andy Savage
Over the next few weeks I am publishing some example analytics for optimising gameplay and customer conversion. I will be using a real world example game, “Ancient Blocks”, which is actually available on the App Store if you want to see the game in full.
The reports in this article were produced using Calq, but you could use an alternative service or build these metrics in-house. This series is designed to be “What to measure” rather than “How to measure it”.
Attached Image: GameStrip.jpg
Common KPIs
The high-level key performance indicators (KPIs) are typically similar across all mobile games, regardless of genre. Most developers will have KPIs that include:
D1, D7, D30 retention – how often players are coming back.
DAU, WAU, MAU – daily, weekly and monthly active users, a measurement of the active playerbase.
User LTVs – what is the lifetime value of a player (typically measured over various cohorts, gender, location, acquiring ad campaign etc).
DARPU – daily average revenue per user, i.e. the amount of revenue generated per active player per day.
ARPPU – average revenue per paying user, a related measurement to LTV but it only counts the subset of users that are actually paying.
There will also be game specific KPIs. These will give insight on isolated parts of the game so that they can be improved. The ultimate goal is improving the high-level KPIs by improving as many sub-game areas as possible.
Retention
Retention is a measure of how often players are coming back to your game after a period. D1 (day 1) retention is how many players returned to play the next day, D7 means 7 days later etc. Retention is a critical indicator of how sticky your game is.
Arguably it’s more important to measure retention than it is to measure revenue. If you have great retention but poor user life-time values (LTV) then you can normally refine and improve the latter. The opposite is not true. It’s much harder to monetise an application with low retention rates.
A retention grid is a good way to visualize game retention over a period
Attached Image: GameExample-Retention.png
When the game is iterated upon (either by adding/removing features, or adjusting existing ones) the retention can be checked to see if the changes had a positive impact.
Active user base
You may have already head of “Daily/Weekly/Monthly” Active Users. These are industry standard measurements showing the size of your active user base. WAU for example, is a count of the unique players that have played in the last 7 days. Using DAU/WAU/MAU measurements is an easy way to spot if your audience is growing, shrinking, or flat.
Attached Image: Retention-DAU.png
Active user measurements need to be analysed along side retention data. Your userbase could be flat if you have lots of new users but are losing existing users (known as “churn”) at the same rate.
Game-specific KPIs
In addition to the common KPIs each game will have additional metrics which are specific to the product in question. This could include data on player progression through the game (such as levels), game mechanics and balance metrics, viral and sharing loops etc.
Most user journeys (paths of interaction that a user can take in your application, such as a menu to start a new game) will also be measured so they can be iterated on and optimised.
For Ancient Blocks game specific metrics include:
Player progression:
Which levels are being completed.
Whether players are replaying on a harder difficulty.
Level difficulty:
How many attempts does it takes to finish a level.
How much time is spent within a level.
How many power ups does a player use before completing a level.
In game currency:
When does a user spend in game currency?
What do they spend it on?
What does a player normally do before they make a puchase?
In-game tutorial
When a player starts a game for the first time, it is typical for them to be shown an interative tutorial that teaches new players how to play. This is often the first impression a user gets of your game and as a result it needs to be extremely well-refined. With a bad tutorial your D1 retention will be poor.
Ancient Blocks has a simple 10 step tutorial that shows the user how to play (by dragging blocks vertically until they are aligned).
Attached Image: GameStrip2.jpg
Goals
The data collected about the tutorial needs to show any areas which could be improved. Typically these are areas where users are getting stuck, or taking too long.
Identify any sticking points within the tutorial (points where users get stuck).
Iteratively these tutorial steps to improve conversion rate (the percentage that get to the end successfully).
Metrics
In order to improve the tutorial a set of tutorial-specific metrics should be defined. For Ancient Blocks the key metrics we need are:
The percentages of players that make it through each tutorial step.
The percentage of players that actually finish the tutorial.
The amount of time spent on each step.
The percentage of players that go on to play the level after the tutorial.
Implementation
Tracking tutorial steps is straight-forward using an action-based analytics platform – in our case, Calq. Ancient Blocks uses a single action called Tutorial Step. This action includes a custom attribute called Step to indicate which tutorial step the user is on (0 indicates the first step). We also want to track how long a user spend on each step (in seconds). To do this we also include a property called Duration.
Action
Properties
Tutorial Step
Step – The current tutorial step (0 for start, 1, 2, 3 … etc).
Duration – The duration (in seconds) the user took to complete the step.
Analysis
Analysing the tutorial data is reasonably easy. Most of the metrics can be found by creating a simple conversion funnel, with one funnel step for each tutorial stage.
The completed funnel query shows the conversion rate of the entire tutorial on a step by step basis. From here it is very easy to see which steps “lose” the most users.
Attached Image: GameExample-Tutorial-Funnel2.png
As you can see from the results: step 4 has a conversion rate of around 97% compared to 99% for the other steps. This step would be a good candidate to improve. Even though it’s only a 1 percentage point difference, that still means around $1k in lost revenue just on that step. Per month! For a popular game the different would be much larger.(source:gamedev)
下一篇:如何创造一款优秀的游戏续作

")
")
")
")


 闽公网安备35020302001549号