每日观察:关注2014年主流市场游戏收益排名等消息(6.25)
1)据gamasutra报道,IGDA最近针对游戏行业玩家的调查报告显示,22%的受访者是女性,76%是男性,2%自称是跨性别者,这意味着游戏行业仍是一个倾向于男性群体的领域。
但值得注意的是,2009年IGDA的调查结果显示,当时的女性玩家仅占比11.5%,这意味着在过去5年中女性玩家已经双倍增长。
从游戏行业工作者的报酬情况来看,几乎有50%参与调查的开发者年收入不足5万美元,19%年收入超过10万美元,其余33%开发者收入介于这两者之间。
这些受访者在游戏行业的平均工作年限为9年,在过去5年中平均受雇于4家不同的公司。
61%受访者在不久的将来仍打算在此领域工作,而那些打算转行的受访者则表示自己更向往“更高质量的生活”。
多数受访者对行业中的“超时赶工”现象有所不满,54%受访者认为“超时赶工”并非游戏开发的必要环节,许多受访者认为自己的工作已经超负荷,38%受访者甚至抱怨加班无补贴的现象。
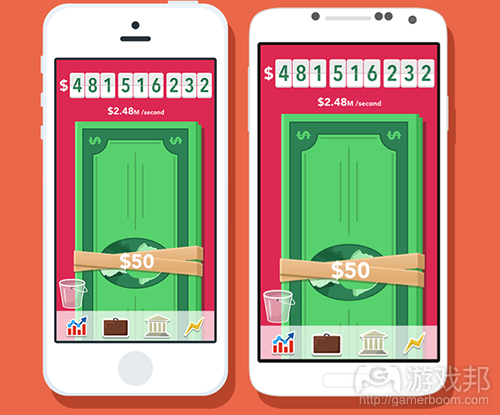
2)据gamesbeat报道,手机应用行业中不但有《Make it Rain》日常收益达5万美元这种新闻,更不乏Walkabout Media, LLC 这种小型开发商月收益仅为160.78美元(2014年4月)的消息。
有位名为Carter Thomas的开发者表示自己曾因采用新盈利方式,而令一周内的应用收益达到800美元;InstaFit这款应用开发者日常收益将近288美元。
年仅18岁的少年开发者Thomas Strock所推出的iOS应用在今年2月份收益达1170美元,此外他还因向亚马逊发布Kindle版本的电子书而大量创收。
3)Forrester Research最近发布的调查报告发现,人们讨厌游戏内置广告甚于网络或视频上的条幅广告。74%受方者认为游戏中的弹出广告令人厌烦,但仅有65%表示讨厌YouTube视频和网页上的条幅广告。
40%智能手机玩家对广告中出现的品牌和产品表示反感,但如果营销人员为玩家提供一些与广告互动的应用内置奖励,这一比例就会急剧下降。
多数人对奖励性广告表示欢迎,74%消费者甚至愿意出让自己的邮箱地址以换取一些优惠,超过半数用户甚至会提供自己的性别、年龄和种族等个人信息来换取这种奖励。
4)App Annie最新报告显示,游戏在Google Play收益中已占比90%,其中98%收益来自免费应用。目前Google Play应用数量超过150万款,从2013年7月至2014年6月,其应用数量增长了60%左右。
Google Play下载量比去年增长了1.5倍,收益则攀升了2.5倍。除了游戏应用之外,Google Play娱乐应用下载量也上升约35%,社交应用下载量增长超过50%,包括Messenger和WhatsApp在内的通信应用下载量增长超过100%。
Google Play多数收益增长来自免费应用,仅有2%收益来自付费下载应用,仅有巴西市场的付费应用(以及同时含有IAP的付费应用)收益比例超过10%。
日本是2014年第一季度Google Play收益最高的市场,其收益同比去年增长了2.4倍,美国市场收益增长了2.6倍,韩国则增长1.9倍。
美国Google Play下载量增长1.2倍,巴西和俄罗斯则分别增长了2.6倍和1.9倍。
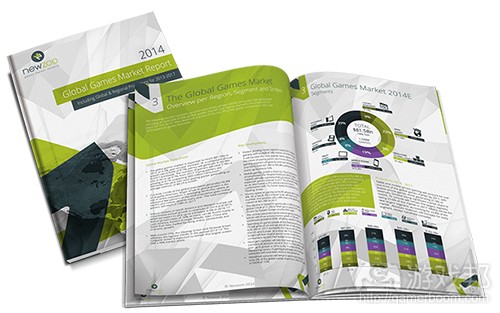
5)Newzoo最近发布数据列出了2014年游戏收益最高的地区和国家排名,美国以205亿美元居于榜首,中国则以179亿美元次之。
报告指出全球已有72亿人口,其中网民用户达29.7亿;游戏玩家达18亿,他们2014年在游戏上的投入将达820亿美元。
2014年游戏收益前20名的国家/地区排名如下:
1.美国:205亿美元
2.中国:179亿美元
3.日本:122亿美元
4.德国:34.3亿美元
5.英国:34.3亿美元
6.韩国:33.6亿美元
7.法国:26亿美元
8.加拿大:17亿美元
9.意大利:15亿美元
10.西班牙:14.9亿美元
11.巴西:13.4亿美元
12.俄罗斯:11.4亿美元
13.澳大利亚:11.4亿美元
14.墨西哥:10亿美元
15.台湾:6.43亿美元
16.印度:5.83亿美元
17.荷兰:4.33亿美元
18.土耳其:3.75亿美元
19.瑞典:3.7亿美元
20.瑞士:3.26亿美元
在前100名榜单中排名最末的是斯里兰卡(2100万人口),游戏收益不足900万美元,甚至次于人口仅43万的马耳他(990万美元)。
从游戏人均收益来看,排名前10名的国家/地区如下:
1.日本:人均120美元
2.韩国:人均79美元
3.美国:人均74美元
4.英国:人均62美元
5.澳大利亚:人均55美元
6.加拿大:人均54美元
7.德国:人均50美元
8.瑞士:人均47美元
9.法国:人均46.38美元
10.爱尔兰:人均46美元
(本文为游戏邦/gamerboom.com编译,拒绝任何不保留版权的转载,如需转载请联系:游戏邦)
1)IGDA: More women are making games, but crunch remains a problem
By Alex Wawro
A recent survey conducted by the International Game Developers Association sought to shed light on the current state of the game industry, and today the IGDA shared some results that suggest the gender diversity of the industry is improving, even as its members continue to struggle with work/life balance.
According to the results, 22 percent of respondents identified as women, 76 percent identified as men and 2 percent identified as transgender or “other”, suggesting that the industry still has a long way to go before we can feasibly consider it a diverse field.
Still, the IGDA makes a point of highlighting that only 11.5 percent of respondents identified as female during a similar 2009 survey, suggesting that the percentage of women working in the industry has roughly doubled in the past five years.
That’s a (very small) bit of good news for the industry, especially when you look back almost ten years to a 2005 IGDA survey that also suggested women represented roughly 11.5 percent of the industry workforce. Given that data, it seems the industry is moving to address at least some of its diversity issues, albeit slowly.
When it comes to compensation, almost fifty percent of developers who participated in the survey make less than $50k a year, while 19 percent make over $100k/year; the remaining 33 percent of developer respondents fall somewhere between the two.
Of course, the average respondent in the IGDA’s survey has spent over nine years working in the game industry, with an average of four different employers in the past five years. Based on results from our own State of the Industry survey, it’s likely that at least one of those stints was as an indie developer as the practice of self-funding and self-publishing becomes more prevalent.
61 percent of those surveyed by the IGDA said they plan to work in the field for the foreseeable future, but the majority of those who were thinking about leaving said they desired a “better quality of life.”
The industry’s persistent demand for crunch seem to be part of the problem; 54 percent of respondents said they believed “crunch time” was not a requisite part of game development, and many said they still felt pressured to work longer hours than were strictly required; 38 percent went on to claim they received no extra compensation for that overtime.
It’s worth noting that the IGDA surveyed more than 2,200 developers in partnership with folks at the University of Western Ontario and the M2 Research organization, and the association plans to release more details from the survey in the near future.(source:gamasutra)
2)Real app developer earnings: From 18-year-old making $1.1K monthly to apps earning $90K per day
Paula Mooney
This post has not been edited by the GamesBeat staff. Opinions by GamesBeat community writers do not necessarily reflect those of the staff.
The above photo of a new gaming app in the iTunes App Store called “Fruit Station” gives us clues as to how some apps are earning money. Simply by looking at the screenshots of the game on iTunes, we can see the telltale hints of in-app purchase income via the “boost store,” which allows gamers to “remove ads” and “double all coin pick ups” for various amounts.
In-app purchases like these are what some developers call “clean” buys – money that the user (or their click-happy kids) intended to spend, proving they like the game at least enough to progress further. Devices like these are helping some app developers clean up in revenue, and are fascinating to witness when you can ferret out the actual income folks are making.
Here are a few app income reports from real people:
#1 – Reality check: $160.78 in one month from gaming apps
A good lesson to learn in the face of all the news about apps like “Make it Rain” making $50,000 per day is that there are still smaller developers like Walkabout Media, LLC making only $160.78 per month as of April 2014, even incorporating the method of re-skinning apps and utilizing in-app purchases.
Despite the “day of small beginnings,” it’s inspiring to see companies like this stick with it, because – who knows – the next app they release could be the one that blows that income amount out of the water.
#2 – Earning $800 in one week with new gaming app monetization methods
“Fun fact – last week the in-app purchases from 3 of my apps made me about $70. The new monetization I’m doing made me $800,” wrote Carter Thomas, waxing nostalgic about how strategies like in-app purchases within gaming apps were dying.
But that was 10 months ago, and reading through the responses on that post shows both how fast the RevMob mentality can shift, along with fascinating comments from the maker of “InstaFit,” who earns approximately $288 per day off the app.
#3 – Thomas Strock: 18-year-old making more than $1,100 per month from apps
I love reading Thomas’ income reports. The most recent one shows that he brought in iOS app income of $1,170 in February 2014. Not one to rest on his laurels, the teenager also brings in a boatload of money from publishing Kindle-edition books on Amazon.
“The vast majority of my money comes from paid apps at the moment,” Thomas wrote in the comments section of that same blog post. Another lesson gleaned from studying his apps is that while some of his previous creations were game-like (such as the now seemingly defunct from the Google Play Store “Madlibs Generator”), the .99 non-gaming ones must be ruling the income roost.
So there’s a good and realistic peek at some real-life income reports from app makers. They might not be the $90,000-per-day earning top iOS apps – at least not yet – but viewing actual moneymakers in the trenches of the gaming app fields helps give us hope and perspective of the industry.(source:venturebeat)
3)We’re cheap: Most mobile gamers will share their personal information for in-app rewards
Jeffrey Grubb
How can you leverage mobile to increase profitability for your company? Find out at MobileBeat, VentureBeat’s 7th annual event on the future of mobile, on July 8-9 in San Francisco. Register now and save $200!
It doesn’t take much to please me. Put on some cartoons, hand over some unsweetened iced tea, or give me a digital sword and I’ll tell you just about anything. Turns out that a lot of mobile gamers are the same way.
A new study by Forrester Research, a consulting and analytics company, found that people hate in-game ads more than banner ads on websites or video. The report, which mobile ad company Tapjoy commissioned, reveals that 74 percent of people find popup in-game ads annoying. That number is 65 percent for banner ads on webpages as well as on YouTube videos. In fact, Forrester found that 40 percent of smartphone gamers feel “negatively” about the brands and products that appear in the ads — but that number decreases drastically when marketers give players in-app rewards for interacting with ads.
Rewarded advertising takes a few forms. If a gamer watches a 30-second ad, it may unlock a new stage. Or if a smartphone owner follows a link to install a new app, they may get a special digital item. People crave in-game rewards so much that 74 percent of consumers will hand over their email address in exchange for some kind of goodies. More than half will hand over their gender, age, and ethnicity for a reward.
“Consumers are not only embracing rewarded advertising, [but] they prefer it, and this Forrester survey shows why,” Tapjoy chief marketing officer Peter Dille said in a statement. “Consumers want control over the experience and to be empowered with the choice of which ad to engage with, and the rewarded model accomplishes that while driving stronger brand sentiment.”
A chart that shows consumers dislike in-game ads more than most other marketing formats.
Above: A chart that shows consumers dislike in-game ads more than most other marketing formats.
While free-to-play games dominate the mobile landscape, a lot of people see popups as an interruption and not as the revenue stream that enables many of these apps to exist. Free-to-play design often puts pressure on players in a number of ways in an effort to encourage them to spend money on in-app purchases — this is likely one of the reasons many don’t see the game itself as a reward for sitting through ads. Rewarded campaigns are a way of making people feel like they are part of the bargain.
“Rewarded in-app advertising takes into account just how personal our mobile devices are and the fact that we’re in a different mindset when we use them,” said Dille. “Rewarded advertising respects the consumer’s role in the advertising ecosystem, which is why advertisers that use it are seeing higher brand affinity and deeper engagements than any other type of advertising.”(source:venturebeat)http://venturebeat.com/2014/06/19/were-cheap-most-mobile-gamers-will-share-their-personal-information-for-in-app-rewards/
4)Google Play growing, growing, growing: Downloads up 1.5x, revenue up 2.5x
John Koetsier
How can you leverage mobile to increase profitability for your company? Find out at MobileBeat, VentureBeat’s 7th annual event on the future of mobile, on July 8-9 in San Francisco. Register now and save $200!
The Google Play Android market is finally generating the revenue its massive download numbers have long promised.
Games now generate 90 percent of Play revenue, and 98 percent of that revenue comes from freemium apps, according to a new report from mobile analytics company App Annie. Japan continues to lead all countries in pouring cash into Google’s coffers, App Annie’s data reveals.
“There are now over 1.5 million apps available on Google Play,” App Annie, which just acquired rival Distimo, said today in its report. “The number of apps grew by around 60 percent between July 2013 and June 2014.”
More: 176 developers with $600M in annual revenue told us what works in Mobile Games Monetization.
But while Google has long had massive download numbers, the revenue it is delivering for developers is now starting to outpace downloads. Downloads were up 1.5 times over the past year, while revenue jumped 2.5 times. That’s great news for developers and bad news for mobile rival Apple, as it shows that Google is getting better and better at monetizing mobile apps, and that consumers — especially in Japan, Brazil, Russian, and India — are spending a lot of money inside the “free” apps they download.
google play revenue growth
While games are huge on Google Play, all categories are trending up and to the right in both downloads and revenue.
Entertainment app downloads jumped about 35 percent, social app downloads grew more than 50 percent, and communication apps — like the ubiquitous Messenger and WhatsApp — jumped more than 100 percent.
Most of the increase in revenue, and almost all the other revenue on Google Play, comes in via freemium apps. Only 2 percent of Play revenue is from pay-to-download apps, with the overwhelming majority coming from in-app purchases. In fact, only one country, Brazil, has more than 10 percent of its revenue coming in via paid apps, or paid apps that also have in-app purchases.
google play revenue
Asia, of course, is still a big story for Google Play — especially Japan.
“Japan continues to dominate Google Play revenue,” App Annie says.
Japan was the top country for Google Play revenue in Q1 2014, continuing a trend with 2.4 times revenue growth compared to the same period last year. But the U.S. jumped ahead of South Korea, with strong 2.6 times growth, while Korea cooled a little to 1.9 times. Germany and the U.K. were both also fast-growth Android regions, although on smaller bases.
google play top countries revenue
The U.S. also saw strong downloads, with 1.2 times growth, but Brazil and Russia were both higher, at 2.6 times and 1.9 times, respectively.(source:venturebeat)
5)Gamer globe: The top 100 countries by 2014 game revenue
John Koetsier
There are 7.2 billion people on this planet, 2.97 billion of which have web access. Of those, 1.8 billion are gamers, and they’ll spend $82 billion in 2014 on Clash of Clans, FIFA 2014, and millions of other games.
The spendiest group? The Japanese, with average annual spend of $120 each.
Gaming research company Newzoo has released a new interactive data resource that highlights the top regions and countries for gaming revenues in 2014. The company, which recently released its 2014 Global Games Market Report, says that the U.S leads all countries with a total spend of $20.5 billion on games, edging out China with $17.9 billion.
north american game revenueThe data clearly show that gaming is no longer about North America and Western Europe. Newzoo CEO Peter Warman said, “The market has become a truly global playground, and the lion’s share of market growth can be found outside of mature markets.”
Here are the top 20:
U.S.A.: $20.5 billion
China: $17.9 billion
Japan: $12.2 billion
Germany: $3.43 billion
U.K.: $3.43 billion
Korea: $3.36 billion
France: $2.6 billion
Canada: $1.7 billion
Italy: $1.5 billion
Spain: $1.49 billion
Brazil: $1.34 billion
Russian Federation: $1.14 billion
Australia: $1.14 billion
Mexico: $1 billion
Taiwan: $643 million
India: $583 million
Netherlands: $433 million
Turkey: $375 million
Sweden: $370 million
Switzerland: $326 million
The last country in the top 100 is Sri Lanka, whose 21 million citizens will spend under $9 million — less even than tiny Malta, whose 430,000 residents will spend $9.9 million.
Newzoo’s 2014 Global Games Market Report is available on VB Intel.
The Newzoo data is live and will be updated frequently. But perhaps even more interestingly, the company has released it in Excel format as well, so you can slice and dice the data — determining, for instance, which countries spend the most on games.
When you divide gaming revenue by online citizens, here are the top 10 highest-spending countries in the world per capita:
Japan: $120/person
Korea: $79/person
U.S.A.: $74/person
U.K.: $62/person
Australia: $55/person
Canada: $54/person
Germany: $50/person
Switzerland: $47/person
France: $46.38/person
Ireland: $46/person(source:venturebeat)


 闽公网安备35020302001549号