


列举衡量F2P游戏表现性能的综合指标
作者:Shyamal Dave
出色的下载量是为你的团队准备一次游艇聚会的正当理由。但作为一家游戏公司中的开发者或者投资者,你需要透过分析数据并越过下载数字进行更深入的了解。以下是游戏业务中用于衡量自己的游戏是否成功的综合参数,这也能够帮助你更好地衡量自己的游戏。
玩家获取参数
如今,新玩家的获取成本大约在0.5美元至2.5美元不等。这很大程度取决于你所选取的用于获取玩家的渠道以及游戏类型,但着眼于市场动态,我们可以清楚地看到这一成本正在不断上升。这是大型发行商主动使用广泛的广告网络去推广自己的游戏,并抬高整体的成本所造成的直接结果。这可能会对已建立的游戏工作室的预算造成一定的影响,但更让人担心的是,这对于独立游戏开发者来说更加不利。
付费vs自然
你是如何获得玩家?自然玩家之所以选择你的游戏是因为在应用商店中注意到它,是因为他们的朋友告诉他们去试试看,或者是因为他们偶然间发现自己的老板也在玩这款游戏。
而付费玩家并不是通过上述的任何一种方式来到你的游戏。是你“购买了”他们。你通过直接或间接的方式付费而推动他们采取行动:点击你的游戏的下载按键。
这是划分玩家的最简单的方式,同时也是任何游戏的最重要的参数之一。
基于国家的安装数量
并不是所有的游戏都像《Candy Crush Saga》那样,即红遍全世界,或者像《Flappy Bird》那样,虽然遭到了轻视但却仍拥有许多玩家。有一些游戏是瞄准特定地区的用户;例如某些针对于日本人,中国人或韩国人所创造的游戏。你的游戏是否在你所设定的目标区域中表现出色?或者有那些其它区域表现出了对你的游戏具有深厚的兴趣?你都可以通过每个国家的安装数量去解决这些问题。
基于架构的安装数量
你是否发行了一个不能强化玩家体验并导致他们突然卸载游戏的《St. Patrick Day》版本?你所推出的最新更新内容是否引起了玩家间的焦虑?或者在一次全面调整后你的游戏下载量突然出现飙升?基于架构的安装数量(不管是正面还是负面)都将向你传达一个重要的信息,因此这是你必须去追踪的重要参数。
K系数
K系数能够帮助用户衡量病毒式增长。
K系数为1意味着你将通过现有的玩家而获得1名玩家,你的游戏并未增长也未衰败。K系数少于1意味着你的游戏要求更多的市场营销努力,否则它将丢掉所有玩家。而K系数大于1则意味着你的游戏正以指数方式增长着。大多数游戏的K系数通常都是<1,所以大多数游戏都未能以指数方式获得增长。
在病毒性方面,K系数能够衡量由“被感染的”玩家所引起的“感染性”。例如,如果你的K系数是0.5,那么每个“被感染的玩家”对于其它玩家的感染力便为0.5(游戏邦注:将推动他们下载/玩你的游戏)。但这并不是真正的病毒性衡量工具,因为还有更多影响因素能够引起病毒性传播,通常是不确定且不可预测的。
CPA和eCPA
CPA是指每用户获取成本。让我们假设你在Chartboost上花了5000美元,并且你获得了2500个新玩家,那么你的CPA便是5000美元/2500=2美元/玩家
现在出现了一些元素能够影响手机游戏用户获取的总成本。这主要是受到像地理区域,平台,类型,下载规模等参数的影响。根据游戏是免费游戏还是付费游戏以及游戏的目标玩家质量,用户获取成本也会有所不同。为了获取高质量的玩家或者更多数量的玩家,你可能需要消费每安装0.5美元至2.5美元的成本。通常情况下这便是你开始需要设定的基本计划。而成本数也会随着你的需求不断增加。
像InMobi或AdMob等广告网络服务可能需要耗费你更多成本,通常情况下是每安装5至10美元。一般情况下只有大型游戏工作室会使用这些网络服务,独立游戏开发者往往支付不起这笔费用。许多开发者更愿意选择Chartboost,因为它无需太昂贵的费用便能够为你提供一定数量的玩家。
eCPA是指有效的每用户获取成本,这是指获取一个玩家的成本,并且因为这个玩家而推动其他人下载你的游戏。在某种程度上,这可以说是对于网络的病毒性潜能的一种衡量。eCAP之所以总是少于CPA是因为它所引起的额外效果。但唯一美中不足的是它很难进行衡量。例如,你该如何去检测它是否是引起连锁反应的特殊用户获取成本指标?
但简单地来说,开发者应该在特定时间期限内以及总投资额间考虑整体的游戏安装数量。让我们假设购买1000个安装的总投资额是2000美元。当月的总安装数量为5000.那么CPA便是2000/1000=2而eCAP为2000/5000=0.4
使用和用户留存参数
用户留存被当成是判断一段时间内活跃玩家的方法。
假设你在市场营销活动的帮助下成功获取了4000名玩家。在第5天的时候,如果其中的2000名玩家还很活跃,那么你的游戏的用户留存便是50%。如果隔天剩下的玩家少了10%,那么第6天的用户留存便是45%,以此类推。通常情况下如果第1天,第7天以及第30天的用户留存率是40%,20%,以及10%便是最理想的状态。这些指标将根据不同的游戏类型发生改变(策略游戏币休闲游戏拥有更高的30天用户留存)。
x天用户留存
这是指玩家在安装游戏后回来玩你的游戏的频率。这通常是以百分比的形式呈现出来,并用于追踪游戏的功能或架构的表现。更高的留存率意味着人们真的很喜欢你的游戏(游戏邦注:具有较高的用户粘性),因此也就具有更高的盈利机会。
明确在过去的4/7/15天,然后是几周,再然后是几个月内各有多少玩家在玩游戏。这对于掌握到底有多少真正的“活跃”玩家来说非常重要。一旦你获得了这些数字,你便可以开始衡量存活玩家以及玩家流失率,即那些活跃在过去某个点上的玩家数量。你能够自由选择参照点,但确保你能够选择一个适当的点,否则这将会破坏你的数据。围绕着这些数字将能够揭示不同类型的数据;例如玩游戏的小时数,玩游戏的时间等等。
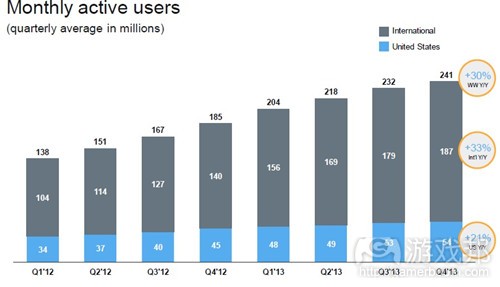
DAU,MAU,DAU/MAU
用于衡量活跃用户的参数DAU是指日活跃用户,而MAU是指越活跃用户。它们分别是指特定天数以及特定月数内的玩家数量。这些数字能够帮助你管理服务器加载等等问题。DAU是更加精确的活跃用户衡量方法,而MAU则通常用于长期规划。
DAU/MAU比率是用于衡量玩家的粘性。这一参数能够测量出一款游戏是否能够有效地留住玩家。在某种程度上这能够呈现出游戏推动用户粘性并有效吸引玩家的潜能,但这并不是销量或IAP数据的指标。
游戏时间长度
玩家待在游戏“中”多长时间?这便是游戏时间长度的答案。让我们假设你看到的是较长的游戏时间,这便意味着玩家沉浸于你的游戏。有些玩家是因为真的对你的游戏非常感兴趣(可能你的游戏真的非常出色),或者因为你的游戏具有较高的难度需要花费玩家更多的时间。即使你所获得的结果是较短的游戏时间,但是在某些情况下你的游戏也是具有较高的用户粘性;当玩家在旅途中或工作中时将会出现较为活跃的游戏时间,而当玩家较为忙碌时游戏时间将终止。所以你必须根据玩家的时间长度而适时调整广告时间表和设计。
用户流失率
用户流失率是指玩家在一个月内停止玩某一特定游戏的比例。玩家经常会对某些游戏感到厌烦并转向其它游戏或应用。而他们这么做的比例便是所谓的用户流失率。
用户流失率=1–留存率
贯穿游戏的进程
在掏腰包前玩家是否玩了多次游戏?他们是在哪一个阶段掏钱?游戏中是否存在多名用户知道要花钱的特殊点?这些都是关于这种类型的玩家行为定性研究的看法。
盈利参数
Monetization metrics(from forbes)
ARPDAU,ARPPU
日活跃用户平均收益(ARPDAU)和每付费用户平均收益(ARPPU)是你需要衡量的两大关键盈利参数。
通过每个月进行测量,ARPDAU基本上是一天的游戏总收益除以特定一天进入游戏的特殊用户数。
ARPU是指每用户平均收入。对于一款休闲游戏来说,它的ARPU可能在0.10美元至0.20美元范围内。这主要是受到市场规模,发展规模,漏斗转换率,订阅价格,微支付转换率等等元素的影响。
LTV(终身价值)是指每位玩家平均消费的钱数。这包括付费玩家和非付费玩家。
LTV=ARPUx(玩家玩游戏的平均月数)
=0.15×6(这里所提到的是休闲游戏的ARPU)
=0.9美元
转换率
转换率是指某一天首次在游戏中花钱的玩家数(编者注:并不是所有报告的转换率都代表一天的数据)。这通常是以百分比的形式呈现出来并用于评估新更新或新内容的效能。大多数转换率优化技巧都是依赖于调整UI并创造更适合玩家的IAP体验。
关于具有极高转换率的iOS游戏的一大经典案例便是Natural Motion Games的《CSR赛车》。该公司的首席执行过Torsten Reil已经暗示过这款游戏具有非常高的转换率。基于如此高的转换率,在2012年,这款游戏在iOS平台上1个月便赚到了超过1200亿美元,转换成IAP大约是40万美元/天。就像Reil所说的那样,这真的是一种完全的自然增长。
通常情况下,休闲游戏的转换率大约是2%至5%。
没有付费用户就没有交易
因为每个游戏开发者都在尝试着将更多创造性带向平台,所以游戏开发的成本也在不断提高。这也是你为何需要追踪付费用户数量的原因。这些用户就是你的忠实拥护者—-所以你更加需要去追踪他们的行为和数量。如果你发现这一数量的减少,你就必须尽快搞清楚原因。
同样地,你也必须追踪交易数量。这是某些升级道具卖得比其它道具更好的指标,也是多名用户重复购买某些内容的指标。同样地,通过追踪更多细节,你将能够看到一个特殊用户做出类似或不同的交易,并根据需求做出改变。
总之,我希望本文能够作为游戏开发者在了解游戏性能时所必须的综合参数列表。你们必须清楚只有特定的参数适用于你自己的游戏。你应该相对地选择适合自己的内容。
(本文为游戏邦/gamerboom.com编译,拒绝任何不保留版权的转载,如需转载请联系:游戏邦)
A comprehensive list of metrics for free-to-play games
By Shyamal Dave
A decent number of downloads is a good head-start and a very good reason to throw a boat-party for your team. But, as a game developer or an investor in a gaming company you need to see through the analytics and understand a lot beyond downloads. Here’s a comprehensive list of metrics used by game businesses to gauge the success of their games, and should help you gauge yours.
Player Acquisition Metrics
Currently the acquisition costs of a new player range from $0.5 to $2.5. This depends a lot on the networks chosen to acquire the players and the genre of the game, but looking at the market dynamics we can clearly see that it is on the rise. This is a direct result of the fact that large publishers are actively employing widespread ad networks to promote their games, driving up the overall costs. This might have a slight effect on the budgets of established game studios, but more worryingly, it sounds very ominous for indie game developers.
Paid vs. Organic
How have you acquired your players? Organic players come to your game because they somehow saw it in the app store, because their friend told them to check it out, or probably while they accidentally saw their boss at it when they expected to see his head pouring over an Excel sheet.
The paid players do not come via any of the aforesaid ways. You ‘buy’ them. Directly or indirectly you have paid for the beautiful action that they did with their finger: click on the download button of your game.
This is the simplest way of segregating your players and often one of the most important metrics for any kind of game.
No. of installs by country
Not all games are a Candy Crush Saga, to be played by individuals across nations, or a Flappy Bird to be equally despised (and yet played). There are certain games that target a particular geographic audience; for example, the games made for the Japanese, Chinese and Korean audience. Has your game worked in the region you expected it to? Or has some other region shown considerable interest in your game? These are some of the relevant questions that can be addressed by interpreting the number of installs per country.
No. of installs by build
Did you release a St. Patrick Day version that wasn’t able to enhance the player’s experience and has led to sudden uninstalls of your game? Has the newest upgrade that you just gave out caused much angst amongst the players? Or a sudden spike in downloads after a major overhaul? Positive or negative, the number of installs by build is surely going to deliver an important message to you, and is thus, an important metric to keep a track of.
k-factor
The k-factor is the measure of viral growth.
A k-factor of 1 means you’re gaining one player through one existing player, and your game is neither growing nor declining. A k-factor of less than 1 means that your game requires marketing efforts, else it might run out of players. While a k-factor greater than 1 means that your game is growing exponentially. Most of the games usually have a k-factor that is <1, as most of the games do not grow exponentially.
In terms of virality, the k-factor measures the ‘infections’ caused by one infected player. For example, if your k-factor is 0.5, then each “infected player” will infect 0.5 other players (and cause them to download/play your game). This however is not a true measure of virality because there are many more factors, usually uncertain and unpredictable, that lead to the virality.
CPA and eCPA
CPA is the Cost Per Acquisition. Let’s say you have spent $5000 on Chartboost and you get 2500 new players your CPA would be $5000/2500 = $2/player.
Now, there are several elements that come into play to affect the overall cost of acquisition for mobile games. Mostly it is affected by parameters such as geographic region, platform, genre, and download size. Depending on whether the game is F2P or paid and the quality of player that it is being delivered to, the cost of acquisition keeps on varying. You might have to churn out $0.5 to $2.5 net per install in order to gain quality players and/or a good number of them. Usually this is what a basic plan that you start with looks like. The bids increase as you pump up the volumes.
The services of ad networks like InMobi or AdMob might cost you a bit more, usually in the range of $5 to $10 per install. These networks generally employed by major game studios and might not be economical for indie game developers. Many developers prefer Chartboost as it gives access to a quality set of players at a decent cost.
The eCPA is the effective Cost Per Acquisition and is the cost of acquiring a player and all the others that result in downloading your game because of this person. In a way, it can be called the measure of the potential of the virality of your network. The eCPA is always less than the CPA because of the additional effect it causes down the line. The biggest and the only catch being, it is very hard to measure. For example, how do you keep a check that it was your particular acquisition spend that caused the ripple effect?
But for simplicity, developers take into account the total number of installs of the game in a time-frame and the total amount invested. Let’s say total amount invested is $2000 for buying 1000 installs. The total number of installs that month was 5000. The CPA is 2000/1000 = 2 [edit: an earlier version of this article incorrectly had this as 0.5. Apologies.] & eCPA is 2000/5000 = 0.4
Usage & Retention Metrics
Retention is defined as a calculation of active players over time.
If say, you successfully acquire 4000 players with the help of a marketing campaign. The retention of your game is 50% on day 5 if 2000 of those players are active on that day. If on the next day, there’s a drop of 10% of the remaining players, then the retention on day 6 is 45%, and so on. Usually the day 1, 7 and 30-days retention rates are measured, and rates of 40%, 20%, and 10% are considered a good benchmark. These benchmarks change drastically according to the genre of the game (strategy games have a high 30-day retention compared to casual games).
Day x retention
This is the frequency of the players returning to play your game after installation. It is often expressed as a percentage and is used to track the performance of features or builds of your game. A high retention indicates that people are really liking it (technically, high engagement) and hence high chance of monetization.
Figure out the set of players who have played in the past 4/7/15 days, then over weeks, and then over months. It is necessary to understand the set of truly ‘active’ players. Once you have these numbers, you can start measuring the survival and churn rates, as a percentage of those who were active a point in the past. You have the liberty of choosing the point of reference, but make sure you choose a proper point, or else this will distort your figures. Playing round the numbers can reveal different types of data; like segregating demographically, or temporal segregation, for example, number of hours played, number of times played.
DAU, MAU, DAU/MAU
The metrics defined to measure the active users are DAU: Daily Active Users and MAU: Monthly Active Users. These are respectively the number of players on a given day and in a given month. These numbers can help you manage the server loads and other such issues. The DAU is considered to be a more accurate measure of active users, whereas the MAU is usually used for long term planning.
The ratio DAU/MAU is used to measure stickiness of your players. How well the game is capable of retaining the players is indicated by this metric. In a way it exhibits the potential of the game to drive engagement and make it extremely compelling for the players, but it’s no indicator of the sales or IAP figures.
Session length
How long do players remain ‘in’ your game? This is answered by the session length. Let’s say you are seeing considerably longer sessions, that means the players are remaining engaged with your game. Some reasons could be high level of interest (your game’s really good, unputdownable), or of a medium to high level of difficulty and is consuming the players’ time. Albeit, if you’re observing shorter sessions, it can be engagement at only certain times; active session while the player is traveling or working, with sessions coming to an abrupt end when someone peeps onto the player’s desk. It becomes necessary for you to tweak your ad schedules and design in order to match with the player’s session length.
Churn rate
The churn rate is the percentage of players who will stop playing a given game in a month. Players often get bored and move onto other games or apps. The rate at which they do so is defined as the churn rate.
Churn rate = 1 – retention rate
Progression through the game
Do players play for some time before making a purchase? What is the stage that they make a purchase on? Is there are any specific point in the game where multiple users have been known to make purchases? These are some of the insights that might come up with this type of qualitative study of player behavior.
Monetization metrics
ARPDAU, ARPPU
The Average Revenue per Daily Active User (ARPDAU) and Average Revenue per Paying User (ARPPU) are two key monetization metrics that need to be measured.
Measured each month, the ARPDAU is basically the total revenue of the game on a day divided by the unique users that logged into the game that specific day.
ARPU is the Average Revenue per (active) User. For a casual game it can be in the range $0.10 to $0.20. It is driven by market size, growth rate, funnel conversion, subscription price, micro-payment conversion, etc.
The LTV (Life Time Value) is the average amount of money spent by each player. It includes the paying and non-paying players.
LTV = ARPU x (Avg no. of months a player plays your game)
= 0.15 x 6 (ARPU for a casual game considered here)
= $0.9
Conversion rate
The conversion rate is defined as the number of players who make an in-game purchase for the first time on a given day (editorial note: not all reported conversion rates represent a daily figure.). It is usually expressed in percentage and is used to assess the effectiveness of new upgrades or offers. Most of the conversion rate optimization techniques rely on the tweaking the UI and making the IAP experience more native for the player.
One classic example of an iOS game with an extremely high conversion rate is Natural Motion Games’s CSR Racing. Torsten Reil, CEO, Natural Motion Games had hinted about the inexplicably high conversion rates of the game. It was because of such strong rates that, in 2012, it was reported earning more than $12 million a month on iOS, translating to IAP of about $400,000/day. As per Reil’s verdict, this has been a completely organic growth.
In general, for casual games, the conversion rate is expected to be about 2-5%.
No of paying users, no of transactions
With each game developer making an attempt to bring in innovation to the platform the cost of development has considerably risen. This is why you need to track the number of paying users. A considerable number of these are your loyalists — it’s even more important to track their behavior and number. If you’re seeing a reduction, it’s important to track the reason ASAP.
In the same way, it is also necessary to track the number of transactions. This is a clear indicator of the upgrade/powerup that is being sold more than others, the repeat purchases of one thing by multiple users. Also, by tracking at even more detail you can see a particular user making similar or varied transactions, and make changes if required.
All in all, I hope this serves as a comprehensive list of the metrics being employed by game developers in order to study the game performance. Keep in mind that only specific metrics can be applied to your particular games. Choose the correct ones.(source:gamesbrief)

")
")
")
")


 闽公网安备35020302001549号