F2P游戏开发新手需知的KPI常识
作者:David Xicota
当我问其他独立游戏开发者为自己的游戏制定了哪些具有经济可行性的计划时……经常会看到一张张茫然无措的脸。
这的确不是他们的错。我们投身电子游戏行业就是因为我们热爱制作游戏,而不是奔着销售游戏的复杂艺术而来的,不是吗?
令人震惊的是多数独立开发者并不知道电子游戏行业的盈利性术语。
游戏概念及其盈利法则是相互影响的。所以我们不建议在游戏开发过程中完全忽略盈利计划。如果不事先制定好盈利计划,你就很容易失败。
以下就是在线游戏领域的一些最重要和常用术语,它们奠定了设计能够吸引玩家的游戏这一重要性的基础。
这些都是最基本的信息,我们不妨将其作为免费电子游戏的关键绩效指标(KPI)。
学习其他开发者所成功用于游戏盈利的变量,有助于你更好的制定开发决策。
基础
*免费模式/F2P
免费提供游戏,通常是通过提供访问高级功能的能力,或相关产品和服务来收费。
*虚拟商品
游戏内置道具或游戏相关服务,例如能量提升道具,付费内容,或者增进/加强玩法的临时订阅服务。
F2P游戏的关键绩效指标
这些将有助于你跟着自己游戏的盈利战略。
*每获取成本(CPA)/每安装成本(CPI)
即获取一名新用户的成本。可以将广告活动成本除以新应用安装量来计算其数值:
CPA=广告成本/新安装量
*每参与成本(CPE)
通过一则参与广告获取新用户的成本。在这种广告中,营销人员要求用户采取有利于游戏的行动,而游戏则提供相应的奖励作为回报。
*用户终身价值(CLV)/终身价值(LTV)
这是以一定折现率预测一名用户未来与应用互动所产生的净利润。其预测模型可能拥有不同程度的复杂性和精确性。
净利润=总利润-获取成本
*月活跃用户(MAU)
在一个月中至少玩过一次该游戏的独立用户数量。
*日活跃用户(DAU)
一天当中至少玩过一次该游戏的独立用户数量。
*粘性系数或DAU/MAU比率
你的粘性系数就是将月活跃用户转化为日活跃用户的能力。这是将DAU除以MAU所得到的结果。转化为百分率后,你就可以知道“每天有百分之几的月活跃用户转变成了日常用户”。例如,假设游戏MAU为60万,DAU为3万,那么其粘性系数就是0.05,也就是每天有5%的月用户转变成了日常用户。
*留存率
你的留存率就是在特定时间段持续玩游戏的用户数量。
留存率(%)=(活跃用户/平均用户数量)*100
平均用户数量(ANU)=(某时段初始用户数量+该时段末用户数量)/2
*流失率/损耗率
你的流失率与某时段不再玩游戏的用户数量有关。这些不再回头的玩家就是“流失者”。
流失率(%)=(不活跃用户/ANU)*100
ANU=(某时段起始用户数量+该时段末用户数量)/2
*留存率+流失率=100%
*每用户平均收益(ARPU)
在特定时间段中,你游戏的ARPU就是由所有活跃用户所创造的收益平均值。
*每日活跃用户平均收益(ARPDAU)
你游戏的ARPDAU就是某日登录游戏的独立用户所创造收益的平均值。
*每付费用户平均收益(ARPPU)
在特定时间段,你游戏的ARPPU就是由所有活跃付费用户创造的收益平均值。这里只需要考虑那些付费用户的数量,可以忽略非付费用户数量。
谁是付费用户?
每名用户都有不同的需求。
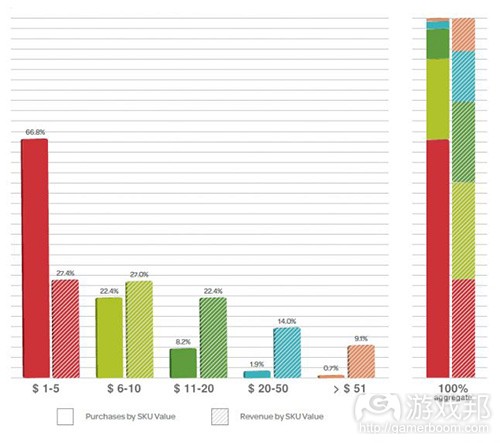
这一图表显示了由IAP价格标签来划分的两组数据。纯色条代表某一比例的IAP数量。条纹条代表由某一比例的IAP创造的收益。
它指出多数购买(67%)来自1-5美元的售价,但它们所创造收益却仅占比27%。
*小鱼用户
小鱼用户每月消费最小,通常少于1欧元。
*海豚用户
他们的投入较为“平均”,通常每月消费额约5欧元。
*鲸鱼用户
鲸鱼投入较大。通常每月投入平均达20欧元。
*不定额用户
这些用户投入巨大,消费额并不固定。其消费范围可从每月数百元至上千元不等。
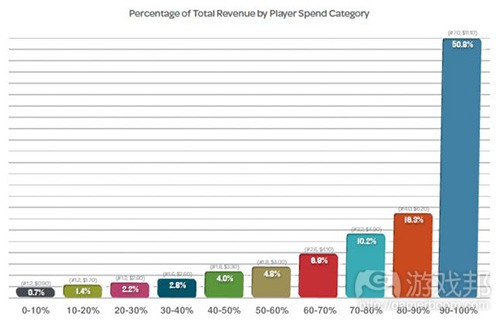
这些条目代表每个群体在收益中所占百分比。
现在你应该更了解自己的玩家情况了,希望本文对KPI的简单介绍能够让你快速理解游戏开发的商务环节。(本文为游戏邦/gamerboom.com编译,拒绝任何不保留版权的转载,如需转载请联系:游戏邦)
Free to play and its Key Performance Indicators
by David Xicota
When I ask other indie game developers what plans they have to make their games financially viable… I can’t tell you how many puzzled faces I get.
It isn’t their fault, really. We’re in the video game industry because we love making games, not for the intricate art of actually selling games. Or, are we not?
It’s shocking that most indie developers don’t know on what terms the monetization in the videogame industry operates.
Game concept and it’s monetization formula impact each other. So, eschewing your monetization plan during game development would be ill-advised. It’s easy to fail if you don’t plan ahead how your monetization strategy will roll out.
Fear not! Following is a glossary of the most relevant and common terminology in the online games industry. They constitute the background of why it’s important to design games that engage with the players.
This is very basic information, so take it as an introduction to the Key Performance Indicators —KPI— for free to play video games.
Learning the variables other developers have successfully used to monetize their games will help you make better development decisions.
The basics
You know these, but it never hurts to refresh the basics just to get started.
▪ Freemium / Free to Play
Offering a game free of charge. Often offering the possibility to get advanced features, functionality, or related products and services that can be purchased.
▪ Virtual Goods
In-game items or game-related services such as power-ups, premium content, or a temporary subscription that enables or enhances gameplay.
Key Performance Indicators —for free to play games
These will help you trace your revenue strategy for your game.
▪ Cost per Acquisition (CpA) / Cost per Install (CpI)
Cost of acquiring new customers. Calculated by dividing the cost of an advertising campaign by the number of new application installs attributable to that campaign.
▪ Cost per Engagement (CpE)
Cost of acquiring new customers through an engaging ad. In this kind of ad, the marketer asks the user to take an action that’s beneficial for the game offering a reward in return.
How Robert Weber upped user retention by 51% using the cost per engagement metric. Click here to read.
▪ Customer Lifetime Value (CLV) / Lifetime Value (LTV)
It is a prediction of the net profit (or gross profit for start-ups) attributed to the entire future relationship with a customer at a discounted rate. The prediction model can have varying levels of sophistication and accuracy.
▪ Monthly Active Users (MAU)
The number of unique users that have played a game at least once over the course of a month.
▪ Daily Active users (DAU)
The number of unique users that have played a game at least once over the course of a day.
▪ Sticky Factor or DAU/MAU Ratio
Your sticky factor is the ability to turn monthly active users into daily active users. This is a ratio calculated by dividing the DAU by the MAU. Converted to a percentage, it answers the question ‘what percentage of my monthly players turn up each day?’ For example, given a MAU of 600,000 and a DAU of 30,000 gives 0.05, that’s 5 per cent of the total monthly players turning up each day.
What is the Social Game Sticky Factor Tipping Point? Click here to read.
▪ Retention Rate
Your retention rate is the amount of users that continued playing your game during a given time period. You’ve “retained” these continuing players.
▪ Churn Rate / Attrition Rate
Your churn rate is the amount of users who stop playing your game during a given time period. These non returning players have “churned”.
▪ Retention Rate + Churn Rate = 100%
▪ Average Revenue Per User (ARPU)
In a given period of time, your game’s ARPU is the result of the division of all the revenue created by all your active users.
▪ Average Revenue Per Daily Active User (ARPDAU)
Your game’s ARPDAU is the total revenue on a day divided by the unique users which logged into the game that specific day.
▪ Average Revenue Per Paying User (ARPPU)
In a given period of time, your game’s ARPPU is the result of the division of all the revenue created by all your active paying users. You only consider the users who spend on your game eschewing all that don’t.
Who are the paying users
Every user has different needs, let me introduce you to them.
Graphic and data from The Swrve Monetization Report, January 2014
This graph shows two figures grouped by the price tag of the in-app purchase (IAP). The plain bars represent the number of IAP in %. The striped bars represent the revenue raised by IAP in %.
It reveals that most purchases (67%) come from the $ 1-5 price tag, but they only raise the 27% of total revenues.
▪ Minnow
Minnows spend the smallest amount possible in a month, typically 1€.
▪ Dolphin
Dolphins spend an “average” amount. Typically its forecast they spend an average of 5€ per month.
▪ Whale
Whales spend a lot. Typically its forecast they spend an average of 20€ per month.
▪ Freeloader
Freeloaders spend buckets of money. This is where the most variability is found in spending. The amounts can range from several hundreds to a few thousands of € per month.
Graphic and data from The Swrve Monetization Report, January 2014
This graph shows the bottom 10% of users who spent the least in total on the left, and move in 10% steps to the top 10% who spent the most in total on the right.
The bars represent the % of revenue that can be attributed to every group.
Now you have a better idea of what your players look like, you’ll be able to put to good use this new knowledge.
I hope this basic introduction to the key performace indicators has helped you have a quick look to the business side of game development.(source:gamasutra)
上一篇:从玩家的角度思考并创造游戏


 闽公网安备35020302001549号