分享用Excel分配用户获取预算的方法(2)
作者:Nick Lim
这是关于用户获取优化系列文章的第2部分。第1部分概括了如何考虑数据预测情况,更准确地对比不同的用户获取渠道。渠道对任何营销活动来说都甚为关键。
在这第2部分中,我们将讨论如何使用这种渠道对比表格,有效分配你的营销预算。
分配预算的意义?
在之前的文章中我们获得了以下表格:
现在让我们假设你在用户获取(简称UA)上一周的预算为1万美元。你可以结合不同的渠道花这笔钱。例如,我们的分配方案S1是在渠道C投入8000美元,并在渠道A投入2000美元。分配方案S2则是在渠道B投入6000美元,在渠道C投入2000美元,在渠道A投入2000美元。
所以分配你的预算意味着确定你想在每个渠道购买多少“单位”。你可以通过更改“单位”栏目,制作如下图表的预算:
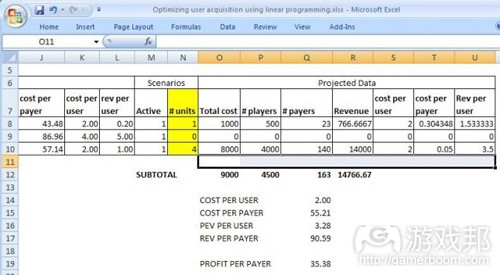
如图所示,分配方案S1拥有渠道C的4个单位,以及渠道A的2个单位。分配方案S2的渠道B有3个单位,渠道C有1个单位,渠道A有2个单位。注意上图是在Excel工作表格中完成的。其中的“单位”是显示在“N”栏。
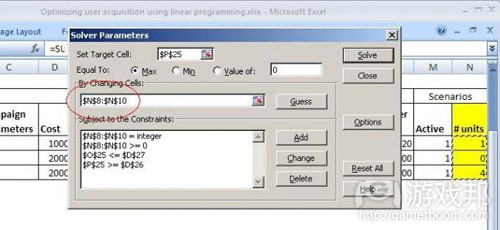
让我们看看Excel解算器工作原理:它的作用就是通过查看许多不同的“单位”组合,找到那些符合你的标准,并且能够最大化或最小化某一指标的结果。Excel解算器是你安装Microsoft Excel的添加程序。以下是解算器对话框的一个截图,显示它将尝试更改“单位”,N栏现在要并列8-10来找到最佳组合。
需要优化什么指标?
为了创造“最优”分配,你必须定义什么是“最优”选择。在某些情况下,这可能是指最低的每用户成本,或者最大化用户获取数量,或者最大化付费用户数量。所以我们显然需要在工作表格内分配这些指标。首先,你要计算各个渠道的指标,之后再统计其总值。以下就是如何在你的Excel工作表格中植入通用指标的方法。
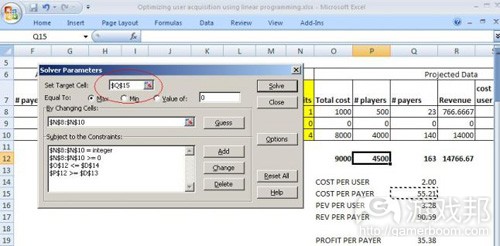
在你确定哪个指标需要优化时,你可以向Excel解算器指出这一点。以下载图显示了解算器对话框中针对Q15的最小化“每付费用户成本”这一设置。
你的上级可能会给你大量同时优化的指标。例如,他们可能想要最低的每用户成本以及最高的每付费用户收益。不幸的是,天下没有免费的午餐,你只能择一而行。你有两个选择:a.从两者中创造单个的指标,例如最大化“每付费用户收益-每付费用户成本”,或者b.选择一个指标进行优化,并约束另一个指标。
约束有助于确定搜索范围
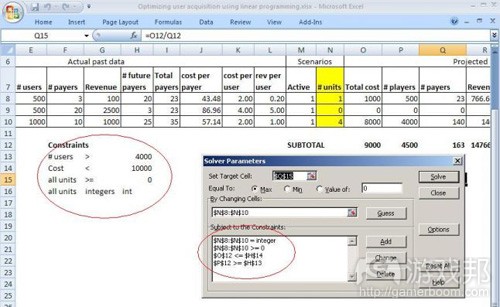
约束是在分配时必须实现的一个额外指标。例如,你可能想让每周的最小新用户数量为4000人。当然你每周的预算限制为1万美元。除此之外,你可能还想让将整数“单位”限制为大于0。Excel解算器支持你指定多个约束条件。我将约束条件输入并指定Excel解算器使用这些约束条件。
现在我们得到了这个基本工作表格,我们可以运行两种情况。
在保证最小玩家数量的同时最小化每用户成本
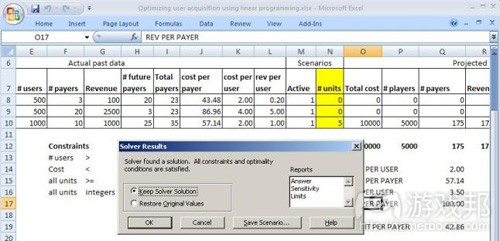
在这种情况下,我们可以将优化指标设为“每付费用户成本”并选择“Min”。这表明你想最小化每付费用户成本。之后你可以将约束条件指定为“用户数量”>=4000,并点击“Solve”。解算器就会生成渠道C的最佳分配单位为5。
在保证最小玩家数量时最大化每用户收益
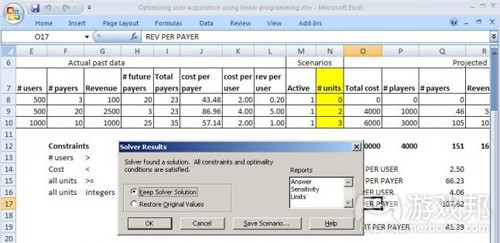
在这种情况下,我们可以将优化指标设为“每用户收益”并选择“Max”。解算器就会生成一个完全不同的解决方案。它会向渠道B分配2个单位,向渠道C分配3个单位。
你还可以尝试其他目标
尝试以下这些目标:
*在保证一定数量的“每用户损失”时最大化玩家数量。
*在保证最小数量的玩家时最大化每付费用户利润。
下一步
现在我们已经完成了使用Excel解算器进行UA优化的介绍。我们还可以用这个工作表格解算其他提升方案。例如,我们如果不想购买特定渠道的用户怎么办?我们该如何考虑在同一个渠道购买额外单位时,可能获得较大“折扣”这一现实?我们将在下篇文章中对此进行解答。(本文为游戏邦/gamerboom.com编译,拒绝任何不保留版权的转载,如需转载请联系:游戏邦)
Improving user acquisition effectiveness with big data Part 2 – Using excel solver to allocate UA budget
by Nick Lim
The following blog post, unless otherwise noted, was written by a member of Gamasutra’s community.
The thoughts and opinions expressed are those of the writer and not Gamasutra or its parent company.
This is part 2 of the user acquisition optimization blog series. Part 1 covered how you can compare different acquisition channels more accurately by incorporating predictions into the data. Channels really meant any source or campaign set up. View a video on this website if you want to learn more about making user predictions.
Part 2 will build on part 1, and show how you will use this channel comparison table to efficiently allocate your UA budget. This post is a hands-on tutorial on using the Excel solver, so be ready to fire up your own spreadsheet.
What does it mean to allocate your budget?
In the previous post we ended up with a table that looks like this:
Now let’s suppose you have a weekly budget of $10,000 to spend on UA. You can spend it in different combinations. For example let’s call allocation S1 as spending $8000 with channel C and $2000 with channel A; allocation S2 is $6000 with channel B, $2000 with channel C and $2000 with channel A.
So allocating your budget means deciding how many “units” of each channel you want to buy. You can represent any allocation like this table below, by changing the “units” column.
So allocation S1 will have 4 units of channel C + 2 units of channel A. Allocation S2 will be 3 units of channel B + 1 unit of channel C + 2 units of Channel A. Note that the image above is for an excel worksheet. The “units” are represented in column N.
Let us look at the Excel solver now: what it does is to look through many different combinations of these “units” and tries to find one that meets all your criteria and maximizes or minimizes one metric. Excel solver is an add-in that you install with Microsoft Excel. Here’s a screenshot of the Solver Dialog Box, showing that it will try to change the “units”, column N rows 8-10 to find an optimal combination.
What is the metric being optimized?
To create an “optimal” allocation, you must define what “optimal” is. In some cases it could be having the lowest cost per user, or it could be getting the most users you can, or getting the most paying users you can. So obviously we will need to calculate some of these metrics inside the worksheet. First you have to calculate the metrics for each channel, then calculate their overall values. Here is an example of how to include common metrics in your excel worksheet.
Once you have decided what your metric is that you want to optimize, you can point the Excel solver to it. This screenshot below shows the Solver Dialog with the setting of minimizing “cost per paying user” which is cell Q15.
Now quite often, your boss may give you multiple simultaneous optimization metrics. For example, they may want to have the lowest cost per user and highest revenue per payer. Unfortunately, there is no free lunch, you can only select one metric to maximize or minimize. Here you have two choices (a) create a single metric from the two, such as maximising “revenue per payer – cost per payer”; or (b) select one metric for optimization and place the other metric under constraints.
Constraints help define the search space
Constraints are additional criteria that must be fulfilled with the allocation. For example, you may want to have a minimum number of new players every week, say 4000. And of course you have the budget limit of $10000. Additionally you probably want the constraint of having integer “units” which are greater than 0. Excel solver allows you to specify multiple constraints. I have put the constraints into cells and pointed the Excel solver to use those constraints.
Now that we have set this basic worksheet up, we can run two scenarios.
Minimizing cost per user while getting a minimum number of players
In this case, we would set the optimization metric to “cost per paying user” and select the “Min”. This indicates you want to minimize the cost per payer. Then you specify the constraints of “number of users” >= 4000, and click Solve. The solver comes up with an optimal allocation of 5 units of Channel C.
Maximizing revenue per user while getting a minimum number of players
In this case, we would set the optimization metric to “revenue per user” and select the “Max” option. The solver comes up with a completely different solution. It allocates 2 units to Channel B and 3 units to Channel C.
Other goals you can try
Try some of these other goals:
maximizing number of players while keeping “loss per player” to a certain number.
maximizing profit per payer while keeping a certain minimum number of players.
Next steps
Congratulations on finishing the introduction to using the Excel solver for UA optimization! There are additional improvements we can make to this worksheet solver. For example, what if we do not want to buy from a specific channel? How do we take into account the fact that when we buy additional units from the same channel, we may get a large “discount”? We will cover these advanced cases in the next post.(source:gamasutra)




 闽公网安备35020302001549号