以Voronoi图表法控制游戏AI的技巧
作者:ernest Adams
游戏中哪条路径最安全,最多敌人的地点应该布置在哪里,离玩家最近的命值包又该放在哪?我们可以用Voronoi(游戏邦注:泰森多边形法,由美国气候学家A·H·Thiessen提出的一种根据离散分布的气象站的降雨量来计算平均降雨量的方法,即将所有相邻气象站连成三角形,作这些三角形各边的垂直平分线,于是每个气象站周围的若干垂直平分线便围成一个多边形)这种数学方法来解决此类常见的空间问题。学习本教程后,你将掌握分析游戏地图,以及产生实现AI现实感的关键信息的工具和知识。
空间关系
空间关系是描述一个空间对象与另一对象关系的情况。例如:它们相互之间的距离,每个对象的占地面积,以及它们所占区域是否重叠,该区域中有多少个此类对象等。
这些关系在电子游戏中频频出现,并且可为AI甚至是玩家提供重要信息。
Voronoi就是答案
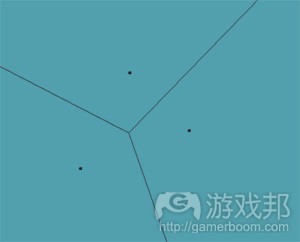
Voronoi图表描述了相邻各点间的空间关系。它是一个源自点或位置的一个连接多边形集合。Voronoi“区域”的每条线都会介于两点之间。
如下图所示:
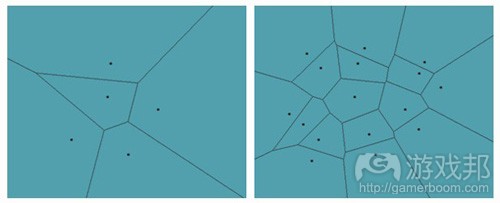
在此你可以看到每两点的中间都有一条线隔开,并且这些线段都会在中间汇合。让我们向该场景添加更多点,看看会发生什么情况:
现在情况更有趣了!我们开始看到实际的区域。
每个区域能够给我们什么启示?我们知道在一个区域里面,我们保证另一个相邻最近的点也在此区域中。这让我们知道哪个点离我们最近,这也是Voronoi图表中空间关系的基本原理。
倒置的Voronoi:狄洛尼三角剖分
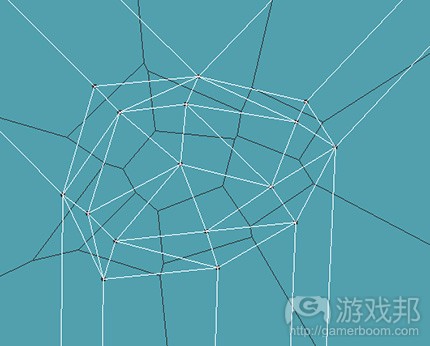
Voronoi图表倒过来就是狄洛尼三角剖分(Delaunay Triangulation)。这个图表是图每个点与其最相邻的点连结起来的线段所组成的,每个线段垂直于它同Voronoi边缘交叉的线。如下图所示:
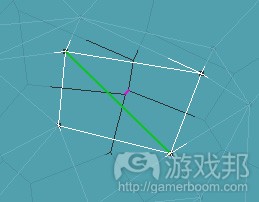
白线就是狄洛尼线段,每条狄洛尼线仅能与一个Voronoi边缘对应。不过乍一看似乎有多个重叠的边缘,让我们深入观察并阐明我们所看到的情况:
在这里,绿色的狄洛尼线与粉色的Voronoi边缘相关。你只要想象粉色边缘深度扩展,就可以看到它们交叉了。
在狄洛尼三角剖分中,你可以看到一系列三角集合,而不是多点的多边形。这一点极为有用,因为我们现在要将一个区域细分为多个可渲染的三角形。这一技术可以用于曲面细分,或三角形划分。
如果你想从一点走到另一点,它也是建立点集图表的好方法。只要将这些点想象为城市即可。
Voronoi数据结构
好,我们已经知道了Voronoi图表是啥样了,现在让我们看看该图表的数据结构。首先,我们要存储成为Voronoi图表的基本点:
class VoronoiPoint {
float x
float y
VoronoiRegion* region
}
每个VoronoiPoint都有一个位置(x, y),以及一个其所在区域的参照。
下一步,我们要描述VoronoiRegion:
class VoronoiRegion {
VoronoiPoint* point
Edge *edges[] // our list of edges
}
该区域向其VoronoiPoint存储了一个参照,以及限制它的一系列VoronoiEdges。
现在让我们看看VoronoiEdges:
class VoronoiEdge {
VoronoiPoint* pointA
VoronoiPoint* pointB
float distance // distance between point A and point B
float x1, z1, x2, z2 // to visualize start & end of the edge
}
一个边缘要由两个点及其中间的距离来定义。为可视化表达形式,或者创造实际的多边形区域形状,你应该存储边缘的起点和结点。
根据这一信息,我们可以轻松使用Voronoi图表了。我们还将研究如何产生Voronoi图表。但现在,让我们先看看如何使用数据的一些例子吧。
找到最近的命值包
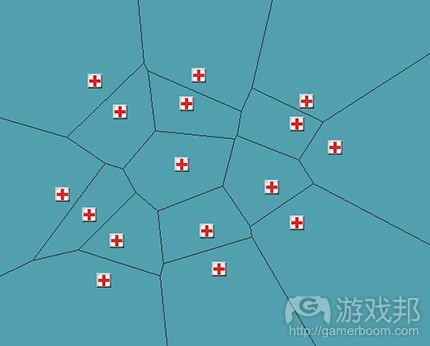
让我们再看看Voronoi图表中的点:
如果每个点代表一个命值包,你就能快速找到最近的命值包——但首先,你得定位你所在的区域。Voronoi图表提供了让你快速找到这个点的有效方法。但你可以在四叉树或R-tree中为每个区域存储一个参照,以便
加快寻找速度。当你找到自己所在区域时,就可以找到最近的邻居以及邻居的邻居。
例如,当你所在区域的命值包不见了的时候,你就要找到下一个最近的命值包。如果我们引用上面提到的数据结构和伪代码,就会知道可以找到一个区域的边缘。找到这些边缘后我们就可以找到邻居。找到最近的邻居后我们就可以知道它有没有命值包。
狄洛尼三角剖分在这里也可以派上用场。它包含每个命值包之间的线段。如果有人拿走了离你最近的所有命值包,我们就可以交叉使用A*寻径法找到下一个最近的命值包。
找到最安全的路径
现在我们将每个点视为敌军警戒塔。你得找到不被他们发觉,从中顺利穿行的最安全路径。在电子游戏中穿过一个图表的普遍方法就是使用A*算法(游戏邦注:详见http://en.wikipedia.org/wiki/A*_search_algorithm)。因为Voronoi是一个图表,因此这一点很容易设置。你只需要有一个支持基因图表结构的A*算法,提前进行一点计划即可。
设置好图表好,我们就要权衡各个边缘。我们所在乎的权重值就是这些警戒塔之间的距离,我们可以从数据结构中直接获取:每个VoronoiEdge都知道它在两点之间的距离。通常情况下A* 边缘的权重值越低越好,但在这种情况下,我们认为更大的权重值更理想,因为它代表了到警戒塔的距离。
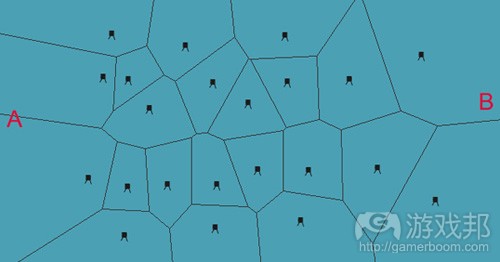
以下是我们从A点移到B点的起始图表范例:
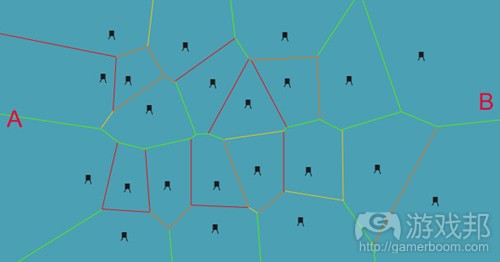
为每个边缘赋予权重,我们就能看到哪条路径最好:
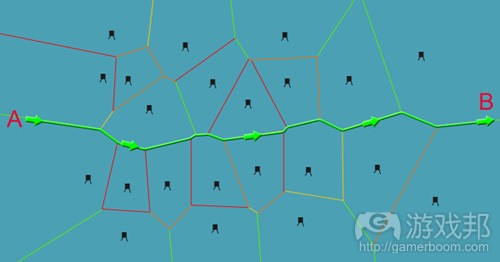
红色边缘代表与警戒塔的最近距离。橙色则代表较近距离,绿色则代表最安全距离。以这些权重值运行A*算法可以生成如下路径:
使用这些权重并不能确保得到最快路径,但却可以得到最安全路径。最好让AI坚持尚这一路径行动,避免走失。
另一个你可以保证安全通行的步骤就是移除低于最小安全距离的边缘。例如,每个警戒塔都有30个单位的视距,那就要移除任何与该点之间少于这个距离的边缘,绝不可由此穿过。
另一个用法是找到无法穿过狭窄空间的大型单位的最宽广路径。因为每个边缘与两点之间都有一个距离,我们就可以知道单位是否能够穿过这一空间。
相反,如果我们使用狄洛尼三角剖分图表,我们就可以得到从每个警戒塔出发的线段。驻扎于警戒塔的守卫AI能够迅速发现最近的警戒塔是哪一个,并且有可能在必要情况下向其移动和提供支援。
找到稠密的道具收集点
假如你打算向某一区域的一群猫咪空投一口袋的猫薄荷,那应该投放在哪里,才能让最多猫咪得到它?这可能需要一个非常非常复杂的计算。但幸运的是,我们可以使用狄洛尼三角剖分法来进行有根据的推测。
提示:记住狄洛尼三解剖分与Voronoi图表相反。它是由Voronoi每个点与来自其边缘的相邻点组成的。
我们可以用这些三角集合检查每个三角形所覆盖的区域。如果我们发现该三角形覆盖了最小区域,那么我们就有三个最靠近的点,或者说三只小猫。这也许不是该区域中小猫分布最稠密的地区,但却是一个很好的猜测方法。如果我们能够投放大量猫薄荷,那么我们就可以标记一下哪些三角形已经在目标范围内,并转向下一个更小的三角形。
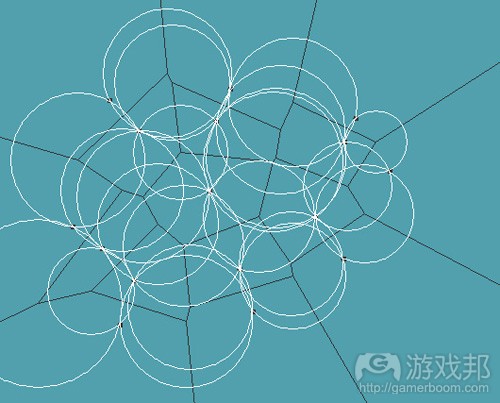
这些区域的表征也称为狄洛尼三角剖分中的环圈。每个圈都是可以嵌入三角形各点间的最大圆圈。以下是Voronoi图表的环圈图:
你可以采用圆圈的最中心来确定投放猫薄荷的中间区域。圆圈的半径实际上更好决定最佳三角形投放区域——尤其是在三角形两点之间相当接近,而另一点较远的时候,这会产生一个非常尖锐而区域狭小的三角形,它可呈现相距甚远的两个点。
执行Voronoi图表法
有多种方法可生成Voronoi图表,你得到数据时就可以决定要采用哪种技术。
Fortune扫描算法
最快的方法就是Fortune扫描算法。它是O(n log(n))并要求所有生成图表的点要在生成的时间呈现。如果你之后添加了新点,就要重新重成整个图表。如果只有几个点,这可能并不是什么大问题,但如果你有10万多个点,那就是很庞大的工作量了。
执行这一算法并不繁琐。你得横切抛物线并处理一些特殊情况。但这并不是最快的技巧。所幸的是,我们还可以使用许多开源执行方法。
让我们先看看它如何运行。
该算法包含穿过点所在的区域扫描一条线段(无论是垂直还是水平方向)。当它遇到一个点时,就会开始由此绘制一条延续扫描线的抛物线。以下就是这一过程的图例:
交叉的抛物线会产生Voronoi边缘。但为什么是抛物线呢?
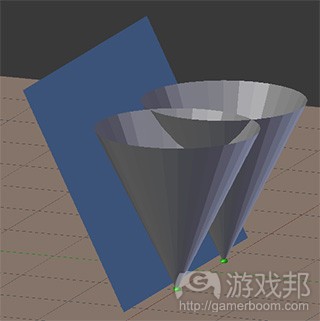
要了解原因,我们要想象每个点都包含一个总在膨胀的气球,直到它与另一个气球接触为止。你可以将此想象成在一个2D平台上膨胀的圆圈。我们还可以更进一步,在每个点上放一个倒置的圆锥体,这个圆锥体有45度的斜面并且无限延伸。然后我们将扫描线想象成一个45度的位面,其扫描方向一直延伸至与圆锥体接触为止。由于位面和圆锥体的角度相同,它们交叉时就会产生抛物线。
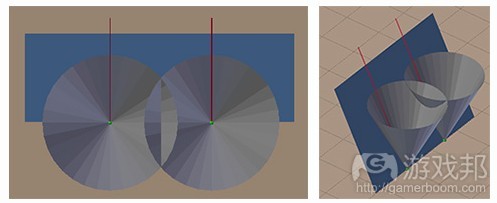
由于圆锥体会垂直生长,最终它们会相互交叉。如果我们查看圆锥体或圆圈的交点点,就会得到Voronoi边缘的直线。你就可以在这里看到圆锥体的交叉点所连接成的直线。如果圆锥体扩展得更大(向上垂直无限延伸),那么红线也会持续延伸。
当位面扫描并首次触及圆锥体时,就会产生如下直线:
随着位面穿过圆锥体,你就可以看到抛物线的形成:
位面持续穿过该场景。它遇到每一个点时,都会检查邻近扫描线,已经拥有抛物线的点,并从这一点开始生成新抛物线。它继续移动并生长,直到这个新抛物线开始与不同于之前的抛物线重叠。之前的抛物线就会封死,这就是三个点的Voronoi线段交集的地方。
正如之前所言,这有点复杂,以下是你可以使用和参考的一些开源执行方法:
Java on GitHub. Authors: Benny Kjær Nielsen and Allan Odgaard https://github.com/sorbits/visual-fortune-algorithm/tree/master
Python on GitHub: https://github.com/MikkoJo/Voronoi. Author: Mikko Johansson
Detailed Fortune’s Algorithm implementation: http://blog.ivank.net/fortunes-algorithm-and-implementation.html
嵌入增量三角形
另一个方法就是每次递增性地插入一个点,一开始是拥有3个点,独立于其他点可行范围的基础三角形。这个技巧是O(n^2),不需要所有的点在生成时间一起呈现出现。
插入一个新点时,它会定位其适合的现成区域。该区域之后就会再划分成多个新区域。
以下是你可以使用和参考的开源案例:
Java source. Author: Paul Chew. Free to use. Download the ZIP file. Source: http://www.cs.cornell.edu/home/chew/Delaunay.html
总结
现在你应该大致了解了Voronoi图表对你的游戏及其AI的作用。使用结构合理的结点和边缘图表,你可以查询重要信息,确保小猫获得它们所需的猫薄荷,从最安全的路径接近它们。(本文为游戏邦/gamerboom.com编译,拒绝任何不保留版权的转载,如需转载请联系:游戏邦)
How to Use Voronoi Diagrams to Control AI
By Brent Owens
What is the safest route to take, where are the most enemies located, and where is the nearest health pack? These common spatial relationship questions can all be solved efficiently with a mathematical routine called Voronoi. By the end of this tutorial you will have the tools and knowledge to analyze your maps and produce information that will be key to the AI’s realism and success.
If you’re interested in reading more about AI (artificial intelligence), be sure to check out:
How to Speed Up A* Pathfinding With the Jump Point Search Algorithm
The Three Simple Rules of Flocking Behaviors: Alignment, Cohesion, and Separation
Understanding Steering Behaviors Series
The Action List Data Structure: Good for UI, AI, Animations, and More
Understanding Goal-Based Vector Field Pathfinding
Spatial Relationships
A spatial relationship is anything that describes how one object in a space is related to another one. For example: their distance from each other, how much area each covers and whether their areas overlap, or how many of these objects are located in one area.
These relationships pop up in video games all the time and can provide very useful information to the AI, or even to the player.
Voronoi Has the Answer
A Voronoi diagram describes the spatial relationship between points that are near each other, or their nearest neighbours. It is a set of connection polygons derived from points or locations. Each line of a Voronoi “region” is halfway between two points.
Here, let’s look at an image to get a feel for it:
How to Use Voronoi Diagrams for Artificial Intelligence in Games
Here you can see that each line is exactly halfway between two points, and that they all meet together in the middle. Let’s add some more points to the scene and see what happens:
How to Use Voronoi Diagrams for Artificial Intelligence in Games
Now, that is getting more interesting! We are starting to get actual regions.
So what does each region tell us? We know that while inside a region, we are guaranteed to be closest to the single point that is also inside the region. This tells us a lot about what is near us and is the fundamental spatial relationship in Voronoi diagrams.
Voronoi Upside Down: The Delaunay Triangulation
The inverse of a Voronoi diagram is called the Delaunay Triangulation. This diagram consists of lines from each point to its nearest neighbours, and each line is perpendicular to the Voronoi edge it crosses. Here is what it looks like:
How to Use Voronoi Diagrams for Artificial Intelligence in Games
The white lines are the Delaunay lines. Each Delaunay line corresponds to one and only one Voronoi edge. Although at first glance it looks like some overlap multiple edges, let’s take a closer look and clarify what we are seeing.
How to Use Voronoi Diagrams for Artificial Intelligence in Games
Here, the green Delaunay line is related to the pink Voronoi edge. You just have to imagine the pink edge extending farther and then you will see that they cross.
With Delaunay you can see we have a set of triangles now instead of many-point polygons. This is incredibly useful as we have now just subdivided an area into renderable triangles. This technique can be used for tessellation, or triangulation of shapes. Super cool!
It’s also a great way to build up the set of points as a graph, in case you want to venture from one point to another. Just imagine that the points are cities.
Voronoi Data Structure
All right, we know what Voronoi looks like; now let’s take a peek at the data structure for a Voronoi diagram. First, we need to store the points that are the basis of the Voronoi diagram:
class VoronoiPoint {
float x
float y
VoronoiRegion* region
}
Each VoronoiPoint has a location (x, y), and a reference to the region it is inside.
Next, we need to describe the VoronoiRegion:
class VoronoiRegion {
VoronoiPoint* point
Edge *edges[] // our list of edges
}
The region stores a reference to its VoronoiPoint, as well as a list of the VoronoiEdges that bound it.
Now let’s look at the VoronoiEdges:
class VoronoiEdge {
VoronoiPoint* pointA
VoronoiPoint* pointB
float distance // distance between point A and point B
float x1, z1, x2, z2 // to visualize start & end of the edge
}
An edge knows the two points that define it, as well as the distance between them. For visual representation, or for building up the actual shape of the polygon region, you should store the start and end points of the edge.
And there we have it. With that information, we can easily use the Voronoi diagram. Farther down, we will look at how to actually generate the Voronoi diagram. But for now, let’s look at some examples of how we can use the data.
Find the Nearest Health Pack
Let’s take a look again at the Voronoi diagram of points.
How to Use Voronoi Diagrams for Artificial Intelligence in Games
If each point represented a health pack, you could find out quite quickly where the nearest one was – but first, you have to locate the region you are in. Voronoi does not provide an efficient way to find this out straight out of the box. However, you can store a reference to each region in a quadtree, or an R-tree, so that the lookup will be quick. And once you have your region, you can find its neighbours, and their neighbours.
For instance, if the health pack in your region is gone, you need a way to find the next closest one. If we refer to our data structure and the pseudocode above, we see that from a region we can find out its edges. And with those edges we can then get the neighbours. Grab the closest neighbour and then we can see whether it has a health pack.
The Delaunay Triangulation can be used here as well. It consists of lines between each of the health packs. This can then be traversed with A* pathfinding to find the next nearest pack if it so happens that someone has grabbed all of the packs near you.
Find the Safest Route
Instead of health packs, let’s picture each point as an enemy guard tower. You need to find the safest way through them without being caught. A common method for traversing a graph in video games is to use the A* algorithm (http://en.wikipedia.org/wiki/A*_search_algorithm). Since the Voronoi diagram is a graph, this is easy to set up. You just need to have an A* algorithm that supports generic graph structures; a little planning ahead of time can pay off here.
With the graph set up, we need to weigh each edge. The weight value we are concerned with is the distance from these guard towers, and we can grab this directly from our data structure: each VoronoiEdge knows its distance between its two points already. Normally a lower value on an A* edge is better, however in this case we want the larger value to be more ideal, since it represents the distance to the tower.
Here is what the starting graph looks like if we want to move from point A to point B:
How to Use Voronoi Diagrams for Artificial Intelligence in Games
Applying the weight to each edge, we start to see what route might be best to take:
How to Use Voronoi Diagrams for Artificial Intelligence in Games
The red edges represent the closest encounters with the towers. The orange less so; yellow less than that; and finally green being the safest. Running A* with these weights should produce the following path:
How to Use Voronoi Diagrams for Artificial Intelligence in Games
Using the weights this way will not ensure the quickest path, but the safest, which is what you want. It would also be wise for the AI to stick close to that path and avoid straying!
Another step you can take to guarantee safe passage is to remove any edges that fall under a minimum safe distance. For example if each guard tower had a vision range of 30 units, then any edges whose distance to their points is less than that could be removed from the graph and not traversed at all.
Another use of this is to find the widest route for units that are large and cannot fit through narrow spaces. Since each edge has a distance between its two points, we know whether it can fit through that space.
Conversely, if we instead used a Delaunay triangulation of the diagram, we would get lines going from each guard tower. A guard AI stationed at a tower could find out quickly what the other nearby towers are, and possibly head over to one to assist it if needed.
Find a Dense Collection of Items
Say you want to air-drop a packet of catnip for a whole bunch of cute kittens in a field. What is the best location to drop it so the most kittens can enjoy it? This could end up being a very, very expensive calculation. But luckily we can make an educated guess by using our Delaunay triangulation.
Tip: Remember that the Delaunay triangulation is just the inverse of the Voronoi diagram. It is simply formed by joining each Voronoi point with its neighbour points obtained from its list of edges.
With this collection of triangles, we can examine the area that each triangle covers. If we find the triangle with the smallest area, then we have the three closest points, or kittens. It may not be the densest average pack of kittens in the field, but it is a good guess. If we are able to drop multiple catnip packets then we can just mark what triangles we already targeted and get the next smallest one.
The representation of these areas is also known as the circum-circles of the Delaunay triangulation. Each circle is the largest circle that can fit within the points of the triangles. Here is an image of the circum-circles for a Voronoi diagram:
How to Use Voronoi Diagrams for Artificial Intelligence in Games
You can use the exact center of the circles to determine the middle of the area to drop the catnip packet. The radius of the circle is actually a better method to determining the best triangle to drop on instead of triangle area – especially if two points of a triangle are very close together and one is far away, producing a very sharp triangle with little area but representing points that are actually quite far apart.
Implementing Voronoi
There are several ways to generate Voronoi diagrams, and the time at which you have the data can help determine which technique to use.
Fortune’s Line-Sweep Algorithm
The fastest method is called Fortune’s Line-sweep Algorithm. It is O(n log(n)) and requires that all points used to generate the graph are present at the time of generation. If you add new points in later, you have to re-generate the whole graph. This might not be a big deal with few points, but if you have 100,000 or so, it could take a while!
Implementing this algorithm is not trivial. You have to intersect parabolas and deal with some special cases. However it is the fastest technique. Luckily, there are many open source implementations of it out there already for you to use and we have linked to them here.
Lets take a quick look at how it works.
The algorithm consists of sweeping a line (either vertical or horizontal) across the area of points. When it encounters a point it begins to draw a parabola from it that continues on with the sweeping line. Here is an animation of the process:
How to Use Voronoi Diagrams for Artificial Intelligence in Games
(Image courtesy of Mnbayazit, released to the public domain.)
The intersecting parabolas produce the Voronoi edges. Why parabolas, though?
To understand that, picture each point containing a balloon that is expanding until it makes contact with another balloon. You can extract this idea into circles expanding on a 2D plane. We take that one step further and place an upside-down cone on each point, a cone that has a slope of 45 degrees and that goes up to infinity. We then imagine the sweep line as a plane, also at 45 degrees, that sweeps along until it comes into contact with the cones. Since the plane and the cones are at the same angle, they produce parabolas when they intersect.
How to Use Voronoi Diagrams for Artificial Intelligence in Games
As the cones grow vertically, eventually they are going to intersect with one or more other cones. If we look at where the cones, or circles, intersect we get the straight lines of the Voronoi edges. Here you can see the red line of where the cones intersect. If the cones expanded some more (went up vertically to infinity), the red line would continue to extend.
How to Use Voronoi Diagrams for Artificial Intelligence in Games
When the plane sweeps across and makes first contact with a cone, a line is produced as so:
How to Use Voronoi Diagrams for Artificial Intelligence in Games
As the plane moves through the cones, you can see the parabolas forming:
How to Use Voronoi Diagrams for Artificial Intelligence in Games
The plane continues through the scene. For every point it encounters, it examines the neighbour points on the sweep line that already have parabolas and begins a new parabola for this point. It continues to move on and grow until this new parabola starts to overlap with a different one than before. That previous parabola is then closed off. This is a place where three points’ Voronoi lines meet.
As stated before, it’s a bit complicated, so here are some open source implementations you can use and examine:
Java on GitHub. Authors: Benny Kjær Nielsen and Allan Odgaard https://github.com/sorbits/visual-fortune-algorithm/tree/master
Python on GitHub: https://github.com/MikkoJo/Voronoi. Author: Mikko Johansson
Detailed Fortune’s Algorithm implementation: http://blog.ivank.net/fortunes-algorithm-and-implementation.html
Incremental Triangle Insertion
Another method is to incrementally insert one point at a time, starting with a base triangle of three points outside of the possible range of all other points. This technique is O(n^2) and does not require all the points to be present at the time of generation.
When a new point is inserted, it locates an existing region that it fits into. That region is then subdivided and new regions are created.
Here is an open source example for you to use and examine:
Java source. Author: Paul Chew. Free to use. Download the ZIP file. Source: http://www.cs.cornell.edu/home/chew/Delaunay.html
Conclusion
By now you should have a feeling for what Voronoi diagrams can provide for your game and its AI. With a well structured graph of nodes and edges you can query important information to ensure the kittens get the catnip they need and that you can take the safest route to get to them. And, just in case, you can find where the nearest med kit is, too.(source:gamedevelopment)
下一篇:游戏设计理论的应用:内在价值









 闽公网安备35020302001549号