每日观察:关注主流手机游戏开发商圣诞节下载量(1.4)
1)Flurry最新报告指出,2012年圣诞节期间(12月25-31日)iOS和Android设备激活量达1740万部,这两个平台应用下载量为3.28亿次。在圣诞假期这一周中,iOS和Android设备激活量超过5000万部,应用下载量达17.6亿次。
在12月份最后一周,应用下载量比该月之前几周的平均水准上升了65%左右。
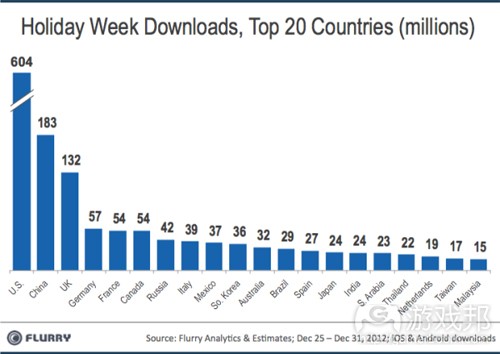
在此期间,美国地区下载量达6.04亿次,占比34.3%;中国位居第二,下载量达1.83亿次;美国地区的iOS和Android设备激活量至今已达1.81亿部,而中国则是1.67亿部。
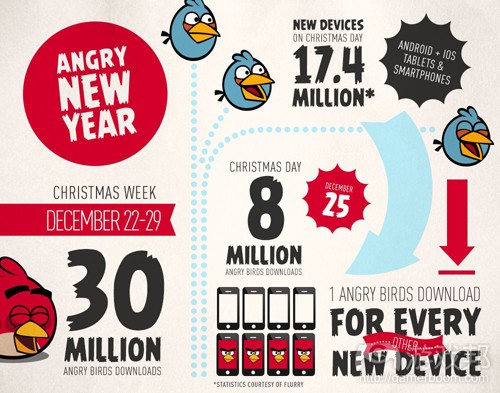
2)据pocketgamer报道,芬兰开发商Rovio最近宣布《愤怒的小鸟》在对圣诞节(12月25日)当天下载量超过800万次,在从2012年12月22日开始的7天中实现3000万次下载量。
Imangi Studios联合创始人Keith Shepherd则通过Twitter宣布《Temple Run》圣诞节当天在iOS和Android平台下载量分别超过100万次,在亚马逊Appstore则超过50万次。
迪士尼手机游戏则在从12月22日起的5天内创造了1500万次下载量(游戏邦注:迪士尼与Imangi合作推出了手机游戏《Temple Run:Brave》);该公司在此期间下载量比去年同期增长了98%,最高峰时的日活跃用户达到750万,同比去年攀升了400%。
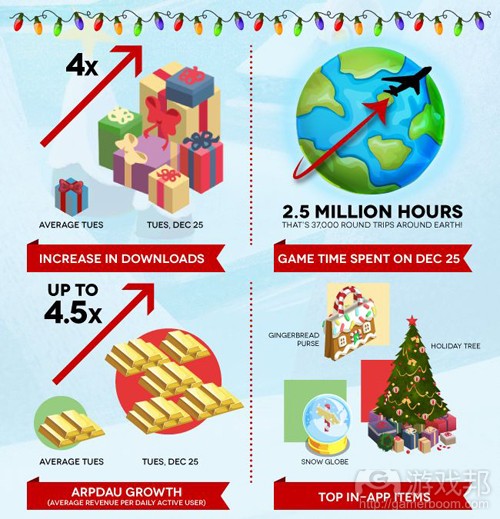
Storm8也宣布圣诞节当天其社交游戏下载量达200万次,比平时的日下载量增长了4倍左右;更值一提的是,Storm8在当天的每用户平均收益增长了350%。
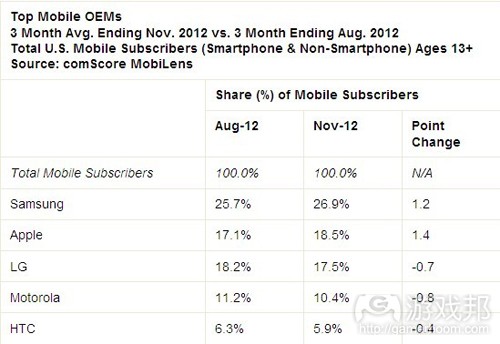
3)comScore最新数据显示,截止2012年11月份,美国已有1.233亿智能手机用户,其中Android用户占比53.7%。在所有美国手机用户中,三星用户规模最大,占比26.9%(游戏邦注:comScore调查样本为3万名美国手机用户)。
苹果iPhone用户排名第二,在所有智能手机用户中占比35%,其美国总体移动市场份额为26.9%;LG排名第三,占比17.5%,摩托罗拉与HTC分别位居第四和第五名,但市场份额均有所下滑。
值得注意的是,这些调查结果并不包含圣诞假期的数据。来自Kantar Worldpanel的数据则显示,苹果iPhone在截止12月25日的前12周中,其美国市场销售份额达到53.3%。
comScore数据还指出,除了Android和iOS之外,RIM、微软和Symbian智能手机市场份额均呈下滑趋势。
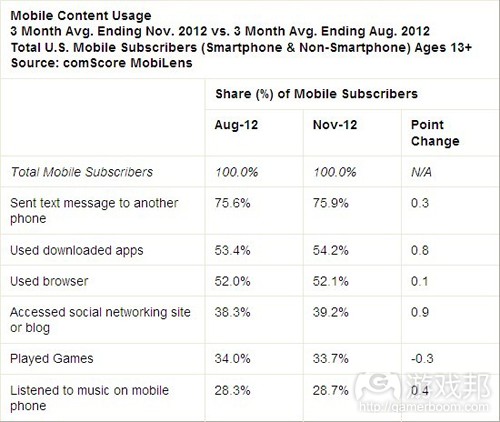
短信仍是最受欢迎的手机功能,75.9%受访者使用手机发短信,并且这一趋势仍在增长。其次是应用程序,有54.2%用户在使用此类服务。第三大热门功能是上网,有52.1%用户使用手机浏览器。
使用手机访问社交网络的用户占比39.2%,玩手机游戏的用户占比33.7%,使用手机听音乐的用户占比28.7%。
4)运营商软件公司Mobidia最近报告指出,威瑞森LTE用户全球第一,达到1490万;其次是日本NTT DoCoMo(620万),第三是韩国SK Telecom(570万),AT&T仅有510万LTE用户。
在美国、日本和韩国这三个地区中,LTE用户使用的网络数据流量均高于3G用户。在韩国,3G用户每月使用数据不足1GB,而LTE用户每月用量却将近2.2GB。
韩国LTE用户比3G用户更少使用Wi-Fi网络,而日本LTE用户对Wi-Fi的使用率也从60%降至51%,美国LTE用户的这一使用比例更是从62%降至59%。
从Wi-Fi和LTE合计的每月人均数据耗量来看,日本和韩国是4.5GB,美国则是3.2GB。
5)NPD Group最新报告显示,美国家庭的连网设备忆达4.25亿台,电脑仍是最主要的网络连接设备,游戏主机、蓝牙播放器以及网络电视所占比例也在不断攀升。
在这些连网设备中,移动设备也极为盛行,智能手机和平板电脑分别占1.33亿部和3180万台。
6)IAMAI最近报告预测,到2014年3月印度移动网络用户将达1.306亿。报告指出在2012年10月,印度已有7870万移动网络用户,其中有6100万用户除了访问运营商所提供的网站服务之外,还会访问其他网站;有1500万用户仅访问运营商所提供服务的网站,还有270万用户使用软件狗上网。
平均每名移动网络用户每月话费为460卢比,其中有198卢比(占比40%)属于上网费用。
这些移动网络用户通常使用手机查看电子邮件,访问社交网络和即时通信服务,而观看在线视频、玩游戏以及在线新闻的频率则是每周2-6次。将近50%移动网络用户会玩在线游戏,但观看在线视频和新闻的用户比例却不足30%。(本文为游戏邦/gamerboom.com编译,拒绝任何不保留版权的转载,如需转载请联系:游戏邦)
1)Holiday 2012 Delivers Historical Worldwide App Downloads
Peter Farago
The most important week of the year for app makers is the final week of the year, between Christmas and New Year’s Day. Starting with Christmas Day, the largest single device activation day of the year, the week between Christmas and New Year’s Day is marked by significantly elevated device activations and app downloads. This is the primary reason why companies jockey to rank well leading up to Christmas Day itself. This report reveals that the last week of 2012 was the largest week for both new device activations and app downloads in iOS and Android history.
For this report, Flurry leverages its data-set from over 260,000 apps running on the significant majority of iOS and Android devices. With its application penetration, Flurry can detect over 90% of all new devices activated each day. Additionally, with its analytics service in more than 25% of all applications downloaded on a given day from the App Store and Google Play, Flurry can reliably estimate total iOS and Android downloads. To benchmark against the market, Flurry regularly triangulates its device and download figures with data released publicly by Google and Apple.
In its most recent report, Flurry estimated that a record-breaking 17.4 million iOS and Android devices were activated on Christmas Day, along with an equally record-breaking 328 million application downloads. Studying the data from December 25 – December 31, additional records were set, now for the highest number of device activations and app downloads of any week in history. Over the holiday week, Flurry estimates that over 50 million iOS and Android devices were activated, and 1.76 billion applications were downloaded. Let’s take a closer look at downloads.
The columns in the chart compare the number of app downloads during Christmas through New Year’s Day (on the right) versus the average of the first two equivalent weeks of December (on the left). The seven days from December 25 – December 31 spanned from a Tuesday to a Monday. As such, we take the average of the first Tuesday-to-Monday weeks in December to establish a baseline. The average downloads over these weeks were surprisingly even. The final week of the year, between Christmas and New Year’s Day, grew by 65% over the early-December baseline, historically breaking through the largest single week record previously set during the same week of 2011. While several weeks since late November delivered billion+ week download levels, the holiday week delivered a record-shattering 1.7 billion downloads.
This second chart shows the top twenty countries across which the record 1.76 billion downloads were distributed. Starting from the left, the U.S. took the lion’s share with 604 million downloads, or 34.3%. Referencing an earlier report, wherein Flurry sized the installed base of top countries, it’s not surprising that the U.S. continues to lead the rest of the world, especially since the fast-closing second place China does not celebrate Christmas (only 3% of China’s population is Christian). Just before the holidays, Flurry estimated that there were 181 million active iOS and Android devices in the U.S. market, compared to 167 million in China.(source:flurry)
2)Merry mobile Christmas: Rovio, Disney and Storm8 enjoy monster festive download spikes
by James Nouch
Earlier today, mobile app analytics firm Flurry estimated that 25 December 2012 played host to 328 million iOS and Android app downloads.
It’s no surprise, then, that mobile games developers are reporting record download spikes for the holiday season.
For instance, Finnish firm Rovio has announced that Angry Birds games accumulated more than 8 million downloads on Christmas day 2012, and 30 million downloads during the seven days beginning 22 December.
Meanwhile, Imangi Studios co-founder Keith Shepherd announced festive figures for Temple Run via Twitter, explaining that the game accrued more than 1 million Christmas day downloads on iOS, more than 1 million on Android, and more than 500,000 on the Amazon Appstore.
Take a peak
Imangi Studios also contributed to Disney’s festive success, as Temple Run: Brave was one of the games that helped the House of Mouse generate 15 million downloads over the five-day period beginning 22 December.
That figure represents a 98 percent increase in downloads against the same period in 2011, and Disney also reported a 400 percent year-on-year increase in peak daily active users, which spiked at 7.5 million.
Finally, California-based developer Storm8 has also been participating in the stat-sharing, announcing that its portfolio of social games generated 2 million downloads on Christmas day alone.
That equates to a four-fold increase in downloads when compared an average day. More importantly, perhaps, Storm8 also saw a Christmas day increase in average revenue per user of 350 percent.(source:pocketgamer)
3)Samsung, Android Remain On Top In U.S. Mobile, Apple Supplants LG As No.2 With 53% Smartphone Penetration: comScore
Ingrid Lunden
By one account Apple is having a very strong quarter in the U.S. in smartphone sales on the strength of the iPhone 5, but overall, Android and specifically Samsung are continuing to dominate the market. According to figures out today from comScore, there are 123.3 million people in the U.S. using smartphones as of November 2012, and Android represents 53.7 of them.
Among all mobile users — smartphone and otherwise — 26.9% of them are using Samsung devices.
The figures, the result of a survey of some 30,000 consumers as part of comScores ongoing MobiLens research, found that Apple’s iPhones account for 35% of all smartphone subscribers, and that its overall mobile share is now at 26.9%. That was enough to put Apple ahead of LG as the country’s number-two mobile brand, with LG now at 17.5%, and Motorola and HTC continuing to round out the top-five, but with smaller market shares than three months before.
The survey, of course, does not include holiday shopping figures, so it will be interesting to see whether Apple inches closer to Samsung, or even surpasses it, as a result of that period.
According to figures from Kantar Worldpanel, Apple’s iPhone, in the 12 weeks that ended November 25, reached its highest-ever sales share in the U.S. market at 53.3%.
comScore also found that the percentage of mobile consumers using smartphones continues to climb. They now stand at 53%, and just as before the rankings continue to demonstrate that it’s an Android/iOS game: RIM, Microsoft and Symbian all lost market share.
But despite the ongoing move to smartphones, people are still using their devices for low-tech activities. Texting remains the most popular form of “mobile content usage” according to comScore, with 75.9% of all consumers saying that they have used their phones for this purpose, and it’s still growing.
App usage is in second position, with 54.2% of consumers noting that they use apps. That grew by 0.8 percentage points, and while at one point web browsing was more popular, it shows that apps are continuing to pull away from mobile browser usage, which grew by only 0.1 percentage points over last quarter. In all, 52.1% of users noting that they used their mobile web browsers.
Among more specific content activities (as opposed to generic “app usage” or “mobile web browsing,” social networking, gaming, and music remained the top-three most popular categories, with gaming the only one among them to lose some popularity.(source:techcrunch)
4)Study: LTE users use less WiFi, eat double the data, and don’t buy the smorgasbord
John Koetsier
More than 110 high-speed LTE networks have now been deployed around the world with the potential to connect almost 500 million people in 50 different countries. But how is the new cellular technology affecting what mobile phone users do?
Mobidia, the carrier software company, just released a study of LTE early adopters, particularly in market-leading countries such as Japan, South Korea, and the U.S.
As of late last year, Verizon had the highest number of LTE customers on the planet, at 14.9 million, trailed by Japan’s NTT DoCoMo with 6.2 million and Korea’s SK Telecom with 5.7 million. AT&T has only 5.1 million LTE subscribers.
In all three countries, LTE subscribers use significantly more data than 3G subscribers. And in Korea, where 3G subscribers use under a gigabyte per month, LTE subscribers gobble up more than double: almost 2.2 GBs of data each and every month.
That increase in data on cellular networks seems to go hand-in-hand with a proportional decrease in data accessed via Wi-Fi. South Korean LTE subscribers actually used less Wi-Fi than 3G subscribers, while in Japan the share of Wi-Fi to cellular traffic for LTE users fell from 60 percent to 51 percent, and in the U.S., share dropped more gradually from 62 percent to 59 percent.
Interestingly, when Mobidia combined data consumed via both Wi-Fi and LTE, a “saturation point” of total data consumption emerges: 4.5GB per month in Japan and South Korea, and 3.2GB per month in the U.S. Apparently, you can use only so much data on a handheld device.(source:venturebeat)
5)There are 425m connected devices in US homes
by Zen Terrelonge
PCs currently lead, but mobile second-screen use will soar this year.
The NPD Group says 425 million devices in US homes are connected to the internet, supporting a recent infographic that said there will be nine connected devices for every American man, woman, and child by 2016.
The computer is still the primary web-enabled device, but games consoles, Blu-ray players and connected TVs are becoming increasingly popular platform for web browsing.
Mobile devices are also hugely popular, with smartphones and tablets accounting for 133m and 31.8m devices respectively, while the second-screen trend (mobile use alongside TV viewing) is expected to rise throughout the year.
John Buffone, director, NPD’s Connected Intelligence, said: “Mobile is adding another dimension powered by screen sharing technologies that allows users to project their tablet or smartphone onto their TV.
“Through 2013, multi-screen and multi-device synergy will lead the growth in the broader connected device market, but only if services consumers desire are delivered in a simplistic manner.
In this connected world, content providers and consumer technology OEMs need to determine the optimal mix of services and have them on the right devices.”(source:mobile-ent)
6)India to reach 130m mobile web users by March 2014
by Daniel Gumble
Number of current Internet users in India stands at 87m.
India is expecting to reach 130.6 million mobile web users by March 2014, growing significantly from its current number, which stands at 87.1 million, according to a report by Internet and Mobile Association of India [IAMAI] and IMRB.
The report in October 2012 indicated that there were 78.7 million mobile users who had been online in the past month, of which 61 million were off-deck users accessing sites other than those of the operator. 15 million were on-deck users, only accessing sites specified by the operator, and 2.7 million users accessed the web with dongles.
Elsewhere, the report revealed that the average monthly bill of a user who visits the web via their mobile device is Rs. 460. Of this figure, the user spends Rs. 198 on Internet expenses, representing a healthy trend on account of the user’s readiness to spend almost 40 per cent of their bill on Internet access.
Mobile Internet users most commonly utilise their devices for email, social networking services and messengers, while online videos, games and online news are accessed around 2-6 times per week. However, while online games are played by nearly 50 per cent of mobile web users, less than 30 per cent look at online news or videos.(source:mobile-ent)








 闽公网安备35020302001549号