每日观察:关注美国App Store前25名应用日均下载量(5.17)
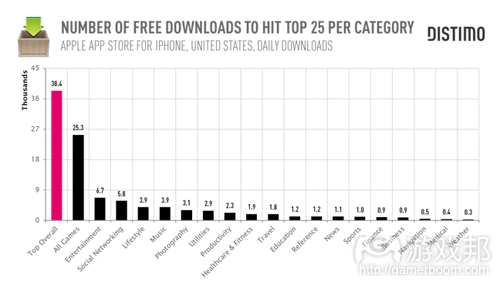
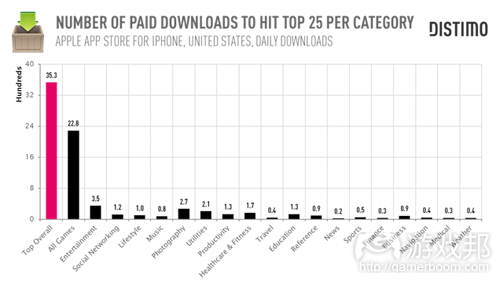
1)Distimo最新报告指出,4月份美国iTunes App Store前25名免费应用榜单的日下载量准入门槛已从去年12月份的4万5000次下降为3万8400次,这种现象或与苹果禁止刷排名的举措有关;前25名付费榜单所需日下载量则是3530次;进入前25名免费应用榜单所需的总体下载量,比进入前25名付费应用榜单高13倍左右。
应用(无论是付费还是免费)若要跻身游戏榜单前25名,就需要创造比进入医疗或天气应用榜单至少高75倍的下载量;游戏应用需实现2万5300次日下载量方有望进入该榜单,而新闻、财经和体育类应用却只需1000次左右的日下载量就能轻松实现这一目标;而付费游戏进入榜单前25名所需日下载量为2280次。
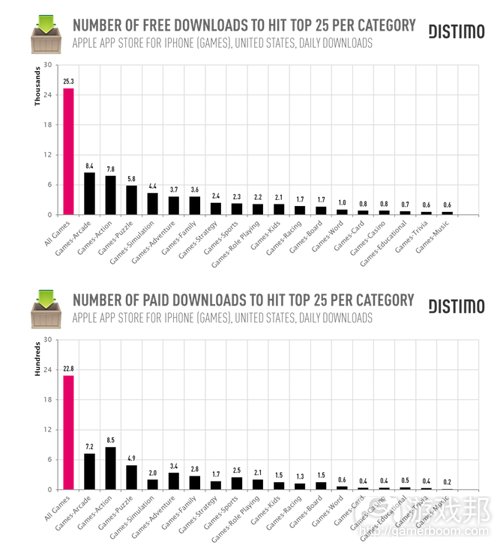
在付费和免费游戏榜单,竞争最激烈的分别是街机、动作、益智类游戏,竞争性最小的则是教育、问答和音乐类游戏。
2)IDC最近发布的应用开发者调查报告指出,75%受访者有意在今年开发的应用中植入HTML5技术,预计到2015年基于HTML5的应用所占比例将达80%。
3)广告公司adsmobi及调研公司mobileSQUARED最近报告预测,2015年亚太10国(游戏邦注:即澳大利亚、中国、印度、印度尼西亚、日本、马来西亚、新加坡、韩国、泰国和越南)投入使用的智能手机将达10亿部;预计2012年该地区移动广告投入将达31.2亿美元,2013年增长至39.4亿美元。
4)尼尔森最新报告称美国手机用户下载应用数量上升,目前平均每名智能手机用户拥有41款应用,比去年增长28%(去年用户平均下载32款应用)。
尽管如此,用户使用这些应用的时间并无明显增长,他们平均每天使用时间约39分钟,仅略高于2011年的37分钟;不过人们在应用中投入的时间比在移动网络中多10%。
有73%受访者称自己很担心个人隐私数据被搜集的问题(去年的这一比例为70%),有55%担心这些个人数据被共享,隐私安全问题可能是影响用户参与度的一大因素。
尼尔森称在过去30天中,Android和iOS应用在所有应有下载量中占比88%(去年的这一数据为74%),但这可能与Android和iOS所占据的美国智能手机市场份额有关(Android美国智能手机用户达3800万,iOS则是8400万)。
这些美国用户最频繁使用的5款应用分别是Facebook、YouTube、Android Market、谷歌搜索引擎和Gmail。
但人们在前50款热门应用中投入的时间却低于去年水平,前50款热门应用当前在人们使用应用时间中占比58%,而2011年的这一比例则是74%,这种现象或许同人们所下载应用数量增长,分散了注意力有关。
5)Adobe最新数据预测,来自平板电脑的网络流量将于明年超过智能手机,目前其流量增长速度比后者快10倍左右,2014年或将占据10%的网络流量。
在2010至2011年期间,平板电脑网络流量增长超过300%(需注意的是,平板电脑问世时间比智能手机还落后两年);既管如此,用户通过PC浏览网站的频率仍然比平板电脑高3倍。
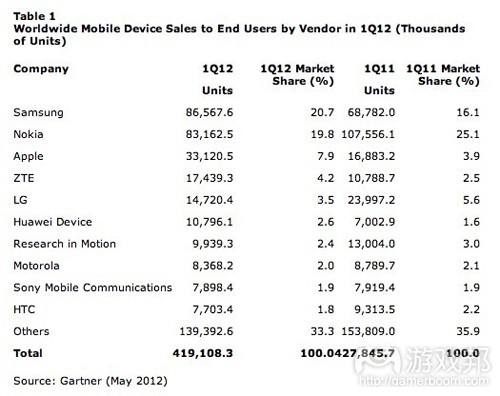
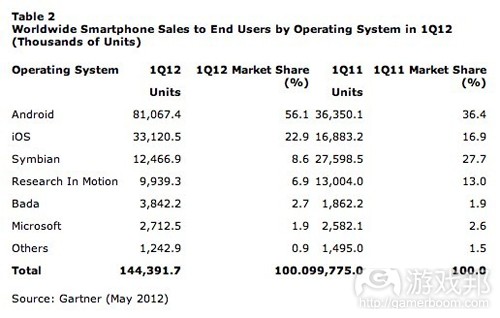
6)Gartner最近数据指出,2012年第一季度全球手机销量下降2个百分点,总销量为4.191亿部,这是自2009年第二季度以来出现的首次销量下滑。
Gartner称这与亚太地区的市场需求下降有关,因为这一时期该市场缺乏富有吸引力的新设备,用户仍在等待新设备发售。
三星以20.7%的市场份额在全球手机销量中居于首位,同时也是本季度第一大智能手机制造商,其智能设备销量达3800万部,超过了苹果的3300万部。三星在Android智能手机设备销量中占比40%,同样称冠Android设备市场。
中国已成为仅次于美国的第二大苹果市场,在该时期的苹果手机销量达500万部(游戏邦注:其中有500万部来自苹果官方销售渠道,另外300万部来自香港“转运”渠道)。RIM移动设备在该时期销量仅990万部,其全球移动市场份额下滑至2.4%;Windows Phone手机销量增长至270万部,略高于去年同期的260万部,但其所占份额已从去年的2.6%降至1.9%。
从总体上看,智能手机在所有手机销量中所占比例仅超过四分之一,销量为1.444亿部。(本文为游戏邦/gamerboom.com编译,拒绝任何不保留版权的转载,如需转载请联系:游戏邦)
1)New figures by category — how many downloads does it take to reach the top of the free and paid iOS charts?
Kathleen De Vere
App tracking company Distimo has released a new report revealing how many downloads it takes to get an app into the top 25 of the free and paid charts in the U.S. iTunes App Store — 38,400 and 3,530, respectively.
The 38,400 figure is down significantly from from what Distimo reported in December, where it took an average of 45,000 downloads a day to to reach the top 25 on the free apps chart in the U.S. It’s likely the number has declined because of Apple’s crackdown on download bots, a tactic some developers used to artificially inflate their app’s position on the free app charts. The effects of Apple’s new policy have been noticeable. In March, for example, Fiksu found that download volume for the top 200 free iPhone apps in the U.S. had dropped by 30 percent, down to the lowest levels the App Store had seen since September 2011.
To get its latest numbers, Distimo monitored the U.S. App Store for the month of April. The report qualifies that the number of downloads needed can vary wildly depending on what category an app falls into. Getting an app into the top 25 of the games category will take at least 75 times the number of downloads it does to get an app into a niche category like medical or weather — a rule that applies to both the free and the paid charts. A game app required around 25,300 downloads, but niche applications like news, finance and sports apps only need to see about 1,000 downloads a day to become chart toppers.
Over the past year, we’ve heard from several developers that the paid version of an app will only see about one tenth of the downloads a free version will, an assertion that seems consistent with what we see on the paid app charts. Distimo found that overall the volume needed to hit the top 25 on the free app charts was 13 times higher than the volume needed to hit the top 25 on the paid app charts. The analytics company also reports that in April a top 25 ranked paid app would need to downloaded 3,530 times in a single day. Games were once again the most competitive category, with an app needing 2,280 paid downloads to reach the top 25.
For both free and paid games, the most competitive categories were arcade, action and puzzle, with educational, trivia and music games being the least popular overall.(source:insidemobileapps)
2)8 out of 10 mobile apps to be based on HTML5 by 2015
by Keith Andrew
The general consensus when it comes to HTML5 apps is that their dominance is a question of when rather than if.
According to IDC, the standard’s big day will come at some point over the course of the next three years.
An infographic published by the firm claims 79 percent of mobile app developers surveyed by IDC are set to integrate HTML5 into their apps they launch in 2012 in some form. But that’s just the start.
Up and up
By 2015, 80 percent of all apps will be in part of wholly based on the language.
The infographic itself is designed to highlight the importance of the Core Mobile Web Platform Community – otherwise known as Coremob – and test suite Ringmark, both of which IDC believes will be crucial in moulding the development of HTML5 over the coming years.
Core concerns
“HTML5 is one of the fastest evolving and most important areas of mobile app innovation,” said IDC’s Scott Ellison.
“Ringmark in turn is an important tool providing mobile app developers the ability to test how well different mobile browsers support key app functionalities, allowing developers to strategise and code accordingly.
“Coremob and Ringmark will also provide mobile browser providers, and the IT industry, valuable insights into how to further develop HTML5 mobile browser capabilities to accelerate the already explosive growth of the mobile apps space.”
In all, IDC claims there will be more than 1 billion HTML5 compatible mobile browsers on the market in 2013, further extending the standard’s reach.(source:pocketgamer)
3)A third of mobile users in ‘Asia 10′ to have smartphones by year end
by Tim Green
And there’ll be one billion smartphones in use across the region by 2015.
A new whitepaper from ad firm adsmobi and research company mobileSQUARED about mobile advertising trends in the APAC region concludes that the whole region is now migrating onto smartphones.
It says there will be one billion smartphones in the Asia10 countries (Australia, China, India, Indonesia, Japan, Malaysia, Singapore, South Korea, Thailand and Vietnam) within three years.
From adsmobi’s point of view, this is great news – powering a total mobile advertising spend in the Asian10 markets of $4 billion by next year.
Nick Lane, mobileSQUARED’s chief analyst, said: “In 2012, the continued rise in smartphones is encouraging a faster-than-expected adoption of mobile internet and app usage across the Asia10 countries.
“Companies like adsmobi are providing the platform that is enabling agencies and brands to develop mobile rich campaigns reaching almost 1 billion people across the region. “This will drive mobile advertising spend across the Asia10 region from $3.12 billion in 2012 to $3.94 billion next year.”(source:mobile-ent)
4)Nielsen: U.S. Consumers Avg App Downloads Up 28% To 41; 4 Of 5 Most Popular Belong To Google
Ingrid Lunden
With smartphone penetration now at 50 percent in the U.S., the world of apps is seeing a knock-on effect in their popularity: according to a new report from Nielsen, mobile consumers are downloading more apps than ever before, with the average number of apps owned by a smartphone user now at 41 — a rise of 28 percent on the 32 apps owned on average last year.
But at the same time, there are hints of people possibly approaching a limit to how much they might use them: despite the rise in app numbers, the amount of time that people are spending in apps has remained essentially flat: collectively, they are being used for 39 minutes per day today, compared to 37 minutes in 2011.
Nielsen also notes that apps seem to be taking a bit of time away from mobile web usage (perhaps this is where the extra two minutes comes from…): it says that users are using apps 10 percent more than the mobile web, compared to last year.
As for why users are spending no more time on apps than they were before: Nielsen doesn’t really explore that issue, but it does note that privacy has slightly increased as an issue for U.S. consumers: some 73 percent note personal data collection as a concern (compared to 70 percent a year ago), with 55 percent saying they are wary of sharing information. It could be that this privacy concern is actually keeping at least some people away from engaging in apps more.
Going back to the increase in app downloads noted by Nielsen, this is something that has been pointed out by the app store owners in a different way: Google says it has now passed 15 billion downloads announced this month, and Apple noted 25 billion downloads in March 2012.
This morning, Gartner released some figures that pointed to even more consolidation among the top handset makers and the top platforms — with Samsung and Apple accounting for 49.3 percent of all smartphones sold in Q1 2012 (compared to just under 30 percent a year ago).
Nielsen’s app figures seem to point to a similar trend: Android and iOS owners accounted for 88 percent of all apps that were downloaded in the past 30 days, it says (up from 74 percent last year). That may partly be to do with their own market share size in the U.S., where Android and Apple’s iOS dominate the smartphone landscape with respectively 38 million and 84 million users — but it also seems to imply that those users are also actively engaging with their respective app stores.
The other significant consolidation trend that Nielsen has picked up on is around what apps are actually getting the most traffic: even as app stores have grown, and our own collections of them have grown, we continue to fixate most on the exact same five apps this year as we did last year: they are Facebook, YouTube, Android Market, Google Search, and Gmail.
Yes, that’s right: you can slam Google, Android and Android fragmentation all you want, but four of the five most popular apps today, as they were last year, are owned by the company, and that’s partly thanks to the popularity of three of them on iOS.
Ironically, that concentration at the top is also being met with growth in long-tail consumption: Nielsen notes that the time spent on the top 50 apps is actually down compared to last year: the top 50 apps today get 58 percent of our app time, compared to 74 percent in 2011. As with our own personal app catalogues growing in size, this points to consumers getting more diverse in terms of what apps they are using overall, not a surprise really when you consider that there are around 1.1 billion apps currently between just Google Play and the Apple App Store.(source:techcrunch)
5)Tablet traffic to outpace smartphone traffic in 2013
by Zen Terrelonge
Accounting for ten per cent of total web traffic.
New data from Adobe says consumers find browsing the web via tablet almost as engaging as PCs, and certainly more than smartphones, with traffic rising ten times faster than the latter.
That’s more than a 300 per cent traffic increase year-on-year between 2010 and 2011, which is impressive given that tablets entered the market a good two years behind smartphones.
This will result in tablets generating more web traffic than smartphones early next year, and ten per cent of all web traffic in 2014.
However, despite the rise of tablet use, people still access the web via PC three times as much.
Brad Rencher, senior VP and general manager, digital marketing business, Adobe, said: “As businesses rethink their digital experiences to include mobile strategies, tablets are emerging as the consumer device of choice.
“Digital CMOs are wise to take a mobile first approach to optimise their digital content and marketing initiatives with a focus on the tablet experience because the consumer demands it.”(source:mobile-ent)
6)Gartner: Q1 2012 Phone Sales Declined 2%, Dragged Down By Asia-Pacific. Samsung Leads All
Ingrid Lunden
Sign of a maturing marketing flattening out, a lack of compelling devices, or a contraction in the economy? Gartner today released figures that note that worldwide sales of mobile phones were actually down by two percent this quarter, to reach a total of 419.1 million units — the first time the market has declined since the second quarter of 2009, the analysts say.
Gartner’s explanation is a slowdown in demand from Asia-Pacific, because of a lack of compelling new devices getting launched in the period: users are simply holding out until something better comes along. Nevertheless, of the vendors that are doing well, Samsung is riding at the top of the list, with 20.7 percent of all mobile sales globally, and among smartphones, it is the only Android vendor to have more than 10 percent market share — with Android now accounting for 56 percent of all smartphone sales in the quarter.
This will be the quarter that people remember as the one when Samsung swapped places with Nokia, with others like Strategy Analytics also showing a similar shift. In Gartner’s calculations of mobile sales, Nokia has now slipped down to second position with 19.8 percent of all mobile sales to Samsung’s 20.7 percent, equivalent to 86.6 million units.
Nokia, Gartner notes, had been in the number-one position since 1998 — but from the looks of its earnings for the last few quarters, it doesn’t appear that Nokia will be regaining the lead any time soon.
(Don’t rule it out yet, though. Nokia just yesterday launched two more low-cost, souped up feature phones that play to the developing markets where it has continued to do alright, despite its market share losses in more advanced countries.)
Among the other trends that Gartner noted, it pointed out that white-box vendors — the long tail of device makers that fill in the “others” category seemed to have been hit the hardest.
It notes that while companies like Nokia may have been selling in less at the retail level, white-box vendors have a supply issue in that they overproduced and now have a build-up of inventory. That will mean very cheap devices will be hitting stores in the next couple of quarters as they try to shift their stock for the next generation of devices. (This by the way was a similar problem Nokia had in Q2 2011, when Gartner suspected this might have made Nokia appear to have a bigger share of sales than it actually had.)
Overall, Samsung and Apple were the only two vendors in the top 1o mobile rankings to have gained market share: the rest all declined, as you can see from the list below.
In smartphones the power of the two is even more pronounced. Samsung and Apple now represent 49.3 percent of all smartphones sold — a sure sign of the consolidation being that a year ago the pair only accounted for 29.3 percent. Nokia’s smartphone share is down to 9.2 percent, Gartner says.
Samsung also managed to wrest the leading smartphone maker crown from Apple this quarter: it sold 38 million units to Apple’s 33 million.
Among Android makers, Samsung is also proving once again that it is the brand to beat: it accounted for 40 percent of all Android smartphone sales. (In that respect, Google’s Motorola buy seems less and less like a device play, or that it can realistically be one.)
But even with Apple in second, its actual growth was hugely impressive, at 96.2 percent over the year. China, Gartner notes, is now Apple’s second-largest market after the U.S. It looks like those sales were 8 million in total: 5 million from Apple’s official sales channges, and another 3 million from “transshipments” from Hong Kong.
More worryingly, RIM sold only 9.9 million units in the quarter and its global mobile share declined down to a mere 2.4 percent (in smartphone-only, that share is 6.9 percent, roughly half of what it was a year ago). BlackBerry 10, its new OS, will hopefully be the knight in shining armor that RIM desperately needs. Also, while Windows Phone actually grew in real terms, with 2.7 million sales in the quarter compared to 2.6 million a year ago, it’s not at all keeping pace with overall growth, and its share is now down to 1.9 percent from 2.6 percent a year ago.
Overall, smartphone sales accounted for just over one-quarter of all mobile sales: they stood at 144.4 million units, out of total mobile sales of 428 million units. That represented growth in smartphone sales of 44.7 percent, Gartner says.
Samsung’s Galaxy S III, the follow up to its best-selling Galaxy S II, was launched only last month and is now gradually getting rolled out worldwide — although it has seen mixed reviews and so it remains to be seen whether it will prove to be a similar blockbuster for the Korean company. In the meantime, we all continue to guess when Apple might release its next iPhone — with many suspecting it will not be until the later half of this year.(source:techcrunch)







 闽公网安备35020302001549号