


开发者推荐使用分析法完善游戏设计
作者:Ben Chong
我是独立开发者,我请很多朋友帮我测试游戏,将游戏塑造成受欢迎的内容。我得到许多“这种内容非常棒”之类的赞美,但当游戏投放市场,这些就变得毫无意义。
全新术语
我听说过所谓的分析法。你能够观察玩家在游戏中的操作,追踪他们的行为,进行相应调节,向他们呈现优质体验!
我用谷歌搜索“游戏分析法”,找到免费跨平台服务Playtomic。它追踪玩家操作,以优美GUI呈现,令我这样的新手也能够轻松看懂。好极了!
游戏背景
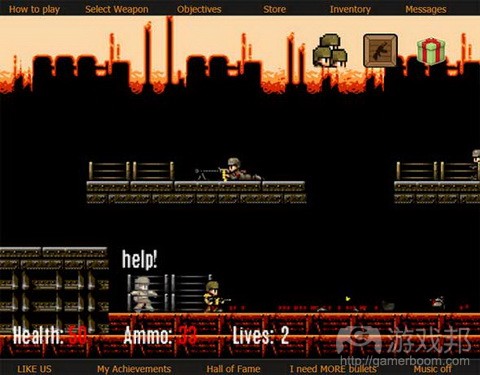
Private Joe from face-gamers.com
《Private Joe》是款2D平台射击游戏。玩家扮演战士角色,试着通过各种武器消灭敌人。玩家会沿途获得金币、徽章和升级道具。
下面是游戏30关卡中的某些参数。
参数 1——开端和死亡
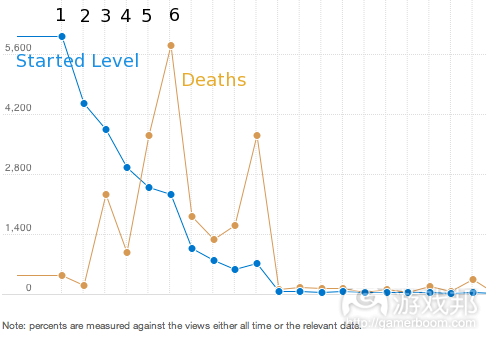
PJCWS started mission level vs deaths from gamasutra.com
蓝线:在关卡1和6后,玩家离开率骤升。
我知道为什么多数玩家玩过一个关卡后便选择离开:用户流动性非常糟糕!任务菜单设计糟糕。多数玩家无法晋升至6以后的关卡,太多人在此关卡丧命!
橙色线:许多玩家在关卡5、6和10被杀。
注意:我排除关卡10的死亡,因为这是boss关卡。
出乎我意料的是很多玩家在关卡5和6死去。我要调查其中原因!我首先想到的是记录玩家频繁死去时的X、Y值,将此绘制在关卡地图上。接着进入热点地图!
参数 2——热点地图
这些内容通常非常易于执行。添加追踪代码,以PNG格式上传关卡5和6的地图,通过Playtomic处理相关数据。
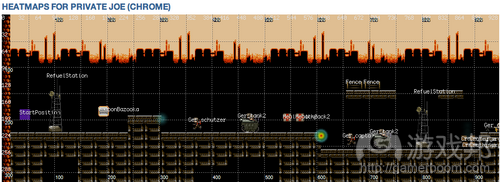
PJCWS heatmap level 6 from gamasutra.com
关卡6的的热图
若干定义:
起点位置(紫色盒子):关卡开始时玩家的衍生位置
Weapon Bazooka:通过收集此元素解锁Bazooka
加油站:发送信息的关卡
Ger_schutzer:基本敌军战士
Ger_captain:高级敌军战士
Ger_tank2:高级敌军坦克
注意关卡6的两个彩色圆点。第一个(300,200)是蓝绿色,代表较低程度的死亡,真正杀手是第二个,接近(600,200)色彩更丰富的圆点。为什么?
敌军坦克有强大的冲头,坦克外壳的袭击威力是常规子弹的3倍。许多玩家都在同2号坦克斗争的过程中丧命,因为在同1号坦克战斗完后他们的生命就受到严重削弱,击败1号坦克后所获的2个健康包帮助不大。
为降低死亡数量,我添加更多健康包,降低坦克的破坏性,移除士兵,移除2号坦克,游戏设计师享有众多选择。若没有分析法,我不会考虑这些内容。
再来看看另一张热图。
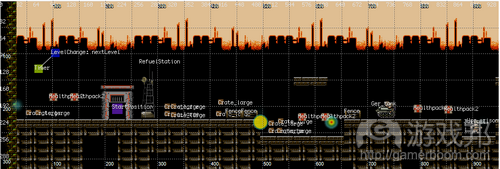
PJCWS heatmap level 5 from gamasutra.com
关卡5的热图
这是个生存任务,玩家要保证自己获胜前60秒不会死去。每隔X秒钟,就会有一波敌人从右边出现,迫使玩家进入防御状态。
有些玩家被敌人逼得向后撤退,在(30,200)死去。
许多玩家会在x=500和x=650间死去(游戏邦注:这就是所谓的死亡区域)。这能够理解:步入新关卡后,玩家倾向向右移动。玩家无法打败平台之上的小坦克,需面对来自进攻敌人的猛烈炮火。为强化效果,我还让敌军喷射式轰炸机每隔X秒就瞄准玩家头部投下炸弹。
死亡区域汇集太多动作。坦克是否过于强大?是否应移除喷射式轰炸机?是否应延伸敌军袭击的间隙?设计师应试验所有可行选择方案。
总结:热图作用显著,你需查看操作发生于何处,然后对游戏做出相应调整。我的目标是让更多玩家顺利前进,所以我做出很多不会影响其他关卡的秘密决策。
参数 3——玩家最喜欢的付费武器
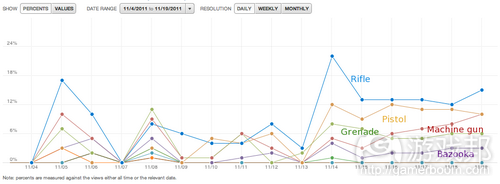
PJCWS favorite weapons from gamasutra.com
步枪(蓝色)似乎是最受欢迎的武器,接着是手枪(橙色)。讽刺的是,这是我投入较少时间的两款道具。我将多数时间用于制作奇妙的Machine Gun反冲效果、Grenade机制和Bazooka爆炸效果。
这是否意味着我浪费宝贵开发时间制作无关紧要的元素?并非如此。我只是需要调节其他7款武器,确保它们能够得到更频繁的利用。这意味着:提高大型枪械的火力,降低道具的价格,或在初始阶段给予玩家更多“试验子弹”。
所以现在我们有很多方案需要测试。这给将来的AB或多元测试做铺垫。为实现此目标,我们需利用Playtomic的“GameVars”功能选择性地控制各种游戏变量。
参数 4:最喜欢的菜单项
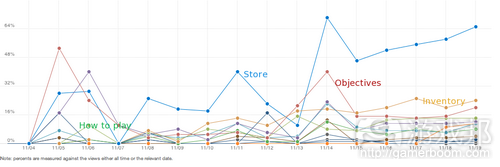
PJCWS favorite menu items from gamasutra.com
我预期多数玩家会点击“存储”按键,事实证明我是对的。玩家需消费因打败敌人而获得的钱币。
游戏初期,“目标”和“如何体验”链接的点击量很高,因为玩家试图弄清如何体验。为缓和这产生的影响,我在游戏中融入简单指南,此指南会在玩家开始关卡内容时弹出。
随着时间的流逝,更多玩家开始关注存储和仓库,这更多缘于子弹数量很少。这说明我可以在玩家返回游戏时给予一个12或24小时间隔的免费子弹回馈。
参数 5——免费&付费
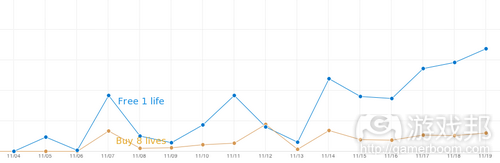
PJCWS popular gameover items from gamasutra.com
孩童时代,我非常讨厌街机游戏的“投币继续游戏”画面。我没有足够钱币玩完《阿斯特利斯和奥比里克斯》。
为鼓励零生命值玩家继续游戏,我提供如下两种选择:
1. 花费80枚硬币购买8次生命,然后在最近关卡重生
2. 获得免费生命,但在起点重生
多数玩家都选择“免费生命”。有些玩家愿意花钱购买生命,因为这换来相应价值:玩家无需在起点重生(游戏邦注:而且可以在后面的游戏中享有8次生命)。
总结
上面是我追踪的5大参数信息。运用得当,分析法是个有效工具,大家都可以运用,不论是玩家社区管理员,还是游戏设计师,抑或是高层管理人员。(本文为游戏邦/gamerboom.com编译,拒绝任何不保留版权的转载,如需转载请联系:游戏邦)
Indie Game Analytics 101
by Ben Chong
Call it designer ego, but I think the world owes me something when I release a game. I mean, I spent like 5 months making this thing from scratch and now it’s SO pretty and therefore everybody including my hero Jordan Mechner should be playing this.
Ignore everything I just said. Obviously the first version bombed and I went back to drawing cute levels on my napkins. Not GOOD enough. I still wasn’t communicating with my players!
As an indie, I had a bunch of friends that helped playtest and shape the game into something that we think players will like. I’ve gotten lots of “dude, this is awesome stuff”-type compliments, but these meant nothing when the game goes into the wild.
Shiny new term
I heard about this new thing they call analytics. Turns out you could see what the player is doing in your game, track their behaviour, tweak it to give them a great experience!
I googled for “game analytics” and found this free cross-platform service called Playtomic . Holy cow: it tracks player events and presents it in a pretty GUI that even a noob like me can fathom. Perfect!
Background of my game
Private Joe is a 2d platform shooter. You play a soldier and try to eliminate enemies with various weapons. Gain coins, badges and powerups along the way. The web version is playable here
Here are some metrics that I’d like to share from my game’s 30 levels.
Metric #1 – Beginnings and Deaths
Blue line: steep player drop rates right after Levels 1 and 6.
I knew immediately why most players left after Level 1 : the user flow was horrible! The missions menu was poorly designed.
Most players couldn’t progress beyond Level 6 because too many died there!
Orange line: most players get killed in levels 5, 6 and 10.
Note: I excluded Level 10′s deaths because it’s a boss level. I shall write a separate article about boss level analytics soon
What I didn’t expect was a high number of players dying in Levels 5 and 6. I had to investigate the cause of this! First thing that comes to mind is to record the x,y coordinates where players die frequently, and plot this over the level map. Enter heatmaps!
Metric #2 – Heatmaps
These were pretty easy to implement. Added the tracking code, uploaded the maps of Levels 5 and 6 as .PNG files, let Playtomic crunch the numbers.
Heatmap of Level 6
Some definitions:
StartPosition (Purple box) : Spawn position of player at start of level
WeaponBazooka : Collecting this unlocks the Bazooka for the player
RefuelStation: A checkpoint to emit messages ( not important here )
Ger_schutzer: Basic enemy soldier
Ger_captain: Advanced enemy soldier
Ger_tank2: Advanced enemy tank
Notice the two colorful spots in Level 6. The first (300,200) is green-bluish, signaling a lower intensity of deaths. The killer is the 2nd, more colorful one near (600,200). What could be the reason?
The enemy tank packs a powerful punch. Getting hit by a tank shell gives 3x more damage than a regular bullet from an enemy soldier. Most players die fighting the 2nd tank, because their lives were reduced too much after fighting the 1st tank. Having two health packs after the 1st tank didn’t seem to help much.
To reduce death numbers, I could add more healthpacks, reduce tank damage, remove the soldiers, remove the 2nd tank, etc… the options are endless for the game designer. Without analytics, I wouldn’t have considered them!
Let’s look at another heatmap
Heatmap of Level 5
This is a survival mission, requiring 60 seconds of not dying before winning. A wave of soldiers will approach from the right every X seconds, trying to force the player into a defensive position.
Some players get pushed back by the wave of enemy soldiers, causing deaths near (30,200).
Most players get killed between x=500 and x=650 (death zone). It makes sense: players are inclined to move to the right once the level loads. They couldn’t beat the small tank just above the ledge, taking heavy fire in the process from incoming soldiers. To pour salt on the wound, I also had an enemy jet bomber drop bombs on the player’s head every X seconds (avoidable of course).
Too much action is concentrated in the death zone. Are tanks just too powerful? Should I just remove the jet bomber? Maybe increase the interval between enemy soldier rushes? All valid options to try out.
Summary: Heatmaps are awesome: you get to see where the action is, and tweak the game accordingly. My goal is to allow more players to progress through, so I made a few secret decisions that would not affect other levels too drastically.
Metric #3 – Favourite weapons to buy
Appears that the rifle (blue) is the favourite weapon, followed by the pistol (orange). Ironically, these were the two weapons I spent the LEAST development time making. I poured most time into making fancy Machine Gun recoils, Grenade mechanics and Bazooka explosion effects. Bummer.
Does that mean I wasted precious dev juice doing unimportant things? No. I just had to tweak the other 7 weapons to make sure they’re utilized more. This can mean: increasing firepower for the big guns, reducing the prices ( players need coins to purchase weapons ) or giving players more “trial bullets” to begin with.
So now we have like a billion options to test against. This sets the scene for a future AB or multivariate testing. To do this, we can use the “GameVars” feature in Playtomic to selectively manipulate variables in-game. AB/multivariate testing is a science which deserves it’s own article: more on this in future posts…
Metric #4 – Favourite menu items
I expected most players to click on the “Store” button and it turned out right! Players need to spend the coins gained from defeating enemies.
It appears that initially, the “Objectives” and “How to play” links got a lot of clicks because players were figuring out how to play. To placate this effect, I added a simple tutorial that pops up the moment players start Level 1.
Over time, more players cared about the Store and Inventory, possibly due to low bullet count. Opportunity rings! I could implement a 12 or 24-hour return bonus that awards free bullets if players come back to play.
Metric #5 – Free vs. paid
As a kid, I always hated the “INSERT CREDIT TO CONTINUE” screen in arcades. Just couldn’t afford all the quarters it took to finish Asterix and Obelix.
To encourage players with zero lives to continue playing, I offered them two choices:
1. buy 8 lives for 80 coins, then respawn at the nearest checkpoint
2. take the free life, but respawn all the way back at the starting point
“Free life” won by majority. The upside? Some people are willing to pay for lives, because it provides value: you don’t need to respawn from the beginning, PLUS you won’t get nagged at for at least the next 8 deaths!
Summary
So there you have it: 5 metrics out of the dozens that I am tracking. Done properly, analytics is an amazing tool that everyone can use – from community managers, to game designers, to upper management.(Source:gamasutra)
上一篇:阐述当代游戏设计的主要发展趋势

")
")
")
")


