每日观察:关注微软应用商店Marketplace发展情况(11.23)
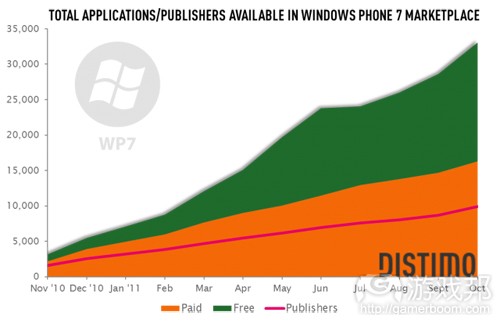
1)移动分析公司Distimo最近针对上线已一年的Windows Phone Marketplace(该应用商店已向35个国家或地区开放服务)调查发现,该应用商店规模正持续扩大,平均每月新增700名发行商,但其应用下载量仍然较少(苹果iPhone App Store下载量比WP Marketplace多39倍)。
尽管Windows Phone已经被舆论视为第三大移动生态圈,但其应用商店规模仅位于第5名,排在苹果、Android、黑莓和诺基亚之后。
该应用商店刚上线时,70%的应用程序属于付费产品,并且这种状态一直持续到2011年2月,其后免费应用的数量才开始飞速发展。今年6月份,其免费应用数量比付费应用多900款。
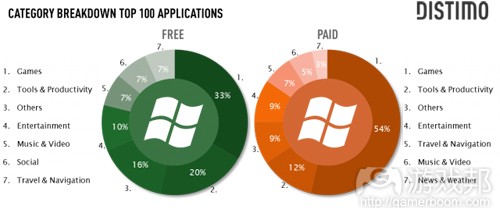
Distimo发现在过去一年中,该平台付费应用数量仍在稳定增长,每月新增1300款付费应用,而免费应用每月增幅约为1650款。与其他应用商店一样,游戏也是Windows Phone应用商店最受欢迎的产品。截止2011年10月份,游戏在该平台前100名免费应用中占比33%,在前100名付费应用中占比54%。
但各个国家市场情况仍存在较大差异,例如在美国和澳大利亚的Marketplace中,游戏在前100名免费应用中占一半比例,但在巴西、韩国、挪威和荷兰,游戏在前100名免费应用中仅占比15%至20%。与此同时,英国、南非市场的游戏在前100名付费应用中占比64%,但在巴西和韩国,游戏在前100名付费应用中仅占比10%(Distimo认为这种情况可能与巴西和韩国苛严的游戏评级制度有关)。
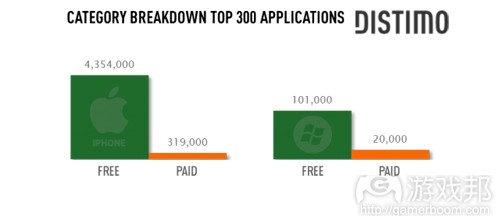
从下载量来看,美国市场最为领先,平均每天下载免费应用10.1万次,以及2万次付费应用(数据取自前300名热门下载应用),但与iPhone平台相比仍大为逊色,后者每天的免费应用下载量是WP Marketplace的43倍,付费应用下载量是16倍。
需要指出的是,Windows Phone的这些付费应用下载量中还包括免费试用版产品。这种类型的“付费”应用占据了80%的下载量,这意味着(在美国市场前300名付费应用中)仅有4000次下载量真正创造了收益。
德国、英国、法国和意大利的WP Marketplace下载量分别居于第二至第五名,但在该应用商店最新开放服务的国家中,日本每日下载量最高,(前300名热门下载应用)平均每天达6000次。
日本和美国应用商店中的内容重叠率最低,分别有215款和1361款本土化应用。智利、葡萄牙、哥伦比亚和南非没有发布本土化产品。Distimo还发现多数国家免费应用的重叠率比付费应用更低,但巴西和韩国例外。
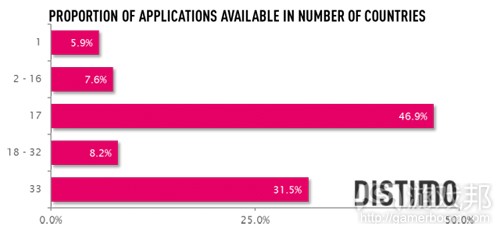
但是,该应用商店有将近半数的产品仅限在最先开放服务的17个国家和地区下载,这种情况表明开发商在Mango 7.5发布时并没有及时更新应用版本,或者没有抓住新开放服务国家/地区的发展机遇。
2)日本游戏发行商Square Enix最近宣布将与运营商KDDI合作,在12月1日面向日本用户推出自己的Andorid应用商店,随后还将向DoCoMo和软银用户开放此项服务(但并未公布具体日期)。
该应用商店的首批游戏包括《Dragon Quest Monsters Most Wanted!, Chaos Ring》、从iOS平台移植过来的《最终幻想》以及《Crystal Defenders》,未来还将推出智能手机版本的《Chrono Trigger》和《Itadaki Street》。
3)comScore最近调查指出,23.5%的法国、德国、意大利、西班牙和英国用户通过移动设备访问社交网络。
46.8%用户每日都登陆社交网络,这些每日活跃用户增长速度甚至高于移动社交网络用户(两者比例分别为67%和44%),通过移动浏览器访问社交网络的用户达3130万,而访问社交网络应用程序的用户为2420万。
Facebook在这欧洲五国中的移动用户比例达71%(3900万人),比去年增长54%。
近860万用户通过移动设备访Twitter,而LinkedIn用户比例增长134%,共达220万。
4)QuickPlay最新调查发现,半数以上英国用户曾在移动设备上看电视或电影,76%年龄在18-44岁的受访者甚至宣称在移动设备上看电视的时间比一年前更多。
其他调查结果包括:
*44%的移动电视观众更喜欢观看现成的电视节目,还有28%则更喜欢观察直播节目;
*多数用户在家观看移动电视节目,但有39%受访者在上下班途中看移动电视内容;
*电视连续剧是最受欢迎的移动电视内容,吸引了近60%的受访者,排在其次的是体育赛事和新闻节目;
*平板电脑用户观看移动电视的时间比智能手机用户更长——20%平板电脑用户曾花1个小时以上连续观看电视节目或电影;
*33%受访者至少每周观看一次移动电视内容,12%几乎每天都看移动电视;
*75%受访者希望服务供应商增加对移动电视内容的投入。
5)据DigiTimes报道,NFC手机支付方式在美国普及率正快速增长,在美国已有7000多家Subway门店支持这种支付方式,预计到2012年更多Android、Symbian和黑莓移动设备也将加入NFC行列。
报道称台湾智能手机制造商认为,随着更多手机厂商采纳NFC技术,NFC手机市场占有率将从目前的10%增长至未来两三年的50%左右。
据称黑莓移动设备是世界首个支持在实体店通过MasterCard PayPass技术付费的手机产品,目前NFC技术尚不发达的原因在于设备标准技术条件、商业运营等方面的问题。
6)NPD最新报告指出,今年1月至10月,非苹果硬件设备制造商共售出120万部平板电脑,总销售额为4.15亿美元,其中多数集中于第三季度,该时期销量是第一季度的6倍。
苹果不久前曾宣布在2011年前三个季度,iPad全球销量超过2500万部,可见非苹果平板电脑市场份额仍远逊于iPad。
但NPD调查结果也显示,有76%的非苹果平板电脑用户表示,他们从来没考虑过要购买iPad。在今年1月至10月,Hewlett Packard是美国市场最为领先的非iPad平板电脑硬件制造商,占据17%的非iPad平板电脑销量。
其他排名靠前的平板电脑品牌包括三星,占16%的非iPad销量,其次是Asus(占比10%)、摩托罗拉和宏碁(分别占比9%)。
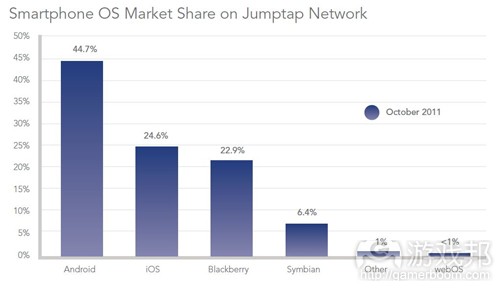
7)移动广告网站Jumptap今年10月报告显示,Android平台在Jumptap网站的全球市场份额下降了3个百分点,目前占比44.7%。出现这种情况的主要原因是,苹果在该时期发布了iPhone 4S。
iOS市场份额在已上升至24.6%,黑莓仍居于第三位,但市场份额不足23%。
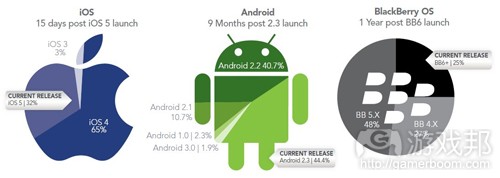
从操作系统版本来看,iOS 5、Android 4.0和BBX OS的用户普及情况差异较大。iOS 5仅发布15天,在Jumptap网站就占据32%的流量,而Android 2.3却历时10个月才达到同样水平。
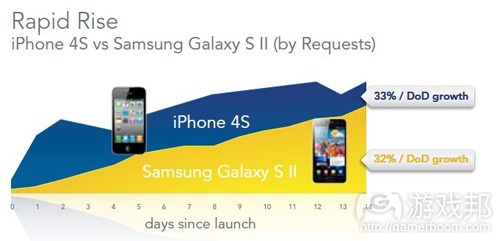
从硬件设备来看,iPhone 4S在该网站每天的广告请求增幅为33%,而三星S II则是32%,但三星用户访问的应用比iPhone用户多27%。
但三星移动设备在Jumptap网站总体广告请求比iPhone多37%,而iPhone用户的活跃度却比三星用户高两倍。
Jumptap指出,游戏是三星智能手机用户最常访问的应用内容,而iPhone用户则更关注新闻和娱乐内容。iPhone 4S广告请求的增长表明,iPhone 3G和3GS用户已升级至iPhone 4S用户,但iPhone 4用户仍在等待苹果发布下一代iPhone。(本文为游戏邦/gamerboom.com编译,拒绝任何不保留版权的转载,如需转载请联系:游戏邦)
1)Windows Phone Marketplace: One Year In
Sarah Perez
Mobile analytics firm Distimo has taken a look at Microsoft’s Windows Phone Marketplace one year after its launch in November 2010. Now available in 35 countries worldwide, the store has grown consistently in size and scope since its debut, at a rate of 700 new publishers added per month. But its app download volume, in comparison with market leader iTunes, is still quite small. In fact, it’s 39 times smaller relative to Apple’s App Store for the iPhone.
The Windows Phone Marketplace was initially available to 17 countries with 18 added later on.* Distimo’s report examines trends among all 35.
Today, Microsoft’s Windows Phone is being hyped as the 3rd major mobile ecosystem, with some analysts even predicting it will steal huge chunks of mobile market share away from Apple’s iPhone by 2015. However, in terms of its app store, it’s still the 5th largest in size, behind Apple, Android, BlackBerry and Nokia.
At its launch, 70% of the mobile apps in the Windows Phone app store were paid and this continued to be the case up until February 2011. At that point, the number of free apps began growing exponentially. By June, there were 900 more free apps than paid apps in the store. But the following month, Microsoft kicked out over a thousand free apps due to developer violations with regards to their policy on “app spam.” (According to Microsoft’s rules, a developer cannot publish more than 20 apps with similar functionalities per day.) Even with the crackdown, the number of free apps continued to grow again, and by October, there were again more free apps than paid ones in the store.
Distimo found that paid apps increased steadily over the past 12 months, with nearly 1,300 new apps per month, while free apps grew by 1,650 new apps per month. As is par for the course in other app stores, games are the most popular category of app for Windows Phone, too, whether free (33% of the top 100) or paid (54% of the top 100). (As of Oct. 2011)
However, when examining local markets, the free/paid mix isn’t always as consistent. For example, in the U.S. and Australian Marketplaces, 50% of the top 100 free apps are games. But in Brazil, South Korea, Norway and The Netherlands, games account for only 15% to 20% of the top free apps. Meanwhile, in the U.K and South Africa, games account for 64% of the top paid apps and in Brazil and South Korea only 10% of the top paid apps are games. This latter situation is likely impacted by those countries’ “notorious” game rating policies, says Distimo.
In terms of downloads, the U.S. leads, with 101,000 free app downloads and 20,000 paid app downloads per day (out of the top 300 most downloaded apps). Compared with the iPhone, though, these numbers are chump change – that market saw 43 times more free downloads and 16 times more paid downloads daily (also out of the top 300).
In addition, when calculating paid downloads, it’s important to note that paid downloads on Windows Phone include free trials. These types of “paid” apps account for 80% of the downloads, which means that only 4,000 downloads (out of the top 300 paid) are generating revenue in the U.S. Marketplace.
Outside of the U.S., the other top download spots include Germany, the U.K., France and Italy, which hold spots 2 through 5. Out of the more recently added countries, Japan has to largest download volume with 6,000 apps (in the top 300) downloaded per day.
Japan and the U.S. also have the most unique content in their stores, with 215 and 1,361 unique apps, respectively. Chile, Portugal, Colombia and South Africa have no unique content. For the most part, the overlap of free apps is lower compared with the overlap of paid apps. This holds true everywhere but Brazil and South Korea, Distimo found.
One not too pleasant finding: nearly half of the applications are only available in the original 17 countries. That means developers did not take advantage of the new countries when launching their apps or have not updated their older pre-Mango apps since the Mango 7.5 release, which brought the additional countries on board. That may be the most interesting finding of all, as it speaks to developer inertia in this app store.(source:techcrunch)
2)Square Enix to launch Android app store via KDDI on December 1
by Matt Sakuraoka-Gilman
Longtime purveyor of the Final Fantasy series – and, more recently, Chaos Rings on smartphones – Japanese publisher Square Enix has laid bare its intentions to open up an Android app store.
The marketplace, which is so far bound only for Japan, will go live on December 1 via carrier KDDI.
Users on other major networks such as DoCoMo or Softbank will also gain access at a later, but as of yet unannounced, date.
Big in Japan
The first games set to be included on the store include Dragon Quest Monsters Most Wanted!, Chaos Ring, the iOS remake of Final Fantasy and Crystal Defenders.
The upcoming smartphone versions of Chrono Trigger and Itadaki Street are also being lined up for release in the future, though no dates have yet been given.
The marketplace’s unveiling comes as Square Enix looks for a major boost to its mobile presence, having recently established the smartphone-focused studio Hippo Labs in Japan.(source:pocketgamer)
3)55m people using social networks via mobile in ‘EU5′ nations
by Tim Green
comScore’s MobiLens study found that social media usage on mobile across France, Germany, Italy, Spain and the UK is so rife that 23.5 per cent of all mobile users are at it.
Nearly half of this audience – 46.8 per cent – access social networking sites on a daily basis. Indeed, daily use is growing faster than mobile social networking as a whole as a whole (67 per cent v 44 per cent).
Interestingly, access via a browser a (31.3m) is greater than access from an app (24.2m).
Needless to say Facebook is the top dog here, with 39 million mobile users or 71 percent of the EU5 mobile social networking audience access it from a phone.
That’s an increase of 54 per cent in the past year.
Nearly 8.6 million mobile users accessed Twitter, while LinkedIn grew by 134 per cent to 2.2 million unique users.(source:mobile-ent)
4)51 per cent have watched TV or a movie on a smartphone or tablet
by Tim Green
QuickPlay study indicates dramatic shift in viewing habits away from the big screen.
The survey found more than half of UK consumers have watched TV or movies on mobile devices, and that 76 per cent of 18-44 year olds say they are watching more TV on these devices than a one year ago.
It all adds fuel to the belief that the combination of 3G, data bundles, wi-fi and hi-res touchscreens are combining to transform viewing habits.
The other main findings were:
* Mobile TV watchers prefer to view on demand TV (44 per cent) compared to 28 per cent who prefer to use mobile devices to watch live programming.
* Most consumers watch mobile TV at home, but 39 per cent watch TV on mobile devices while commuting.
* TV episodes are the most frequently viewed type of content with nearly 60 per cent of respondents watching them, followed by sporting events and news.
* Tablet device users watch mobile TV for far longer than those using smartphones – 20 per cent of tablet device users reported having spent more than an hour of uninterrupted time watching a TV programme or a movie.
* 33 per cent of mobile TV viewers watch at least once per week and 12 per cent viewing almost every day.
* 75 per cent of respondents would like their service provider to invest more in their mobile TV services.
“We’re in the midst of a massive transformation of the way consumers watch TV and movies,” said Mark Hyland, VP of sales and marketing for QuickPlay Media. (source:mobile-ent)
5)NFC in over 50 per cent of smartphones by 2015?
by Zen Terrelonge
Up from current ten per cent, according to Taiwanese developers.
Although the tap-to-pay tech has seen increasing adoption by companies including 7,000 Subway stores in the US it hasn’t yet seen widespread development in mobiles.
This will change in 2012 as Android, Symbian and Blackberry devices will be joined in use of NFC by Windows Phone and iOS platforms, according to DigiTimes.
The site claims Taiwan-based smartphone makers believe that with more phone firms using NFC, this will push growth from the current ten per cent to more than 50 per cent in the next two to three years.
Last month we reported BlackBerry devices were the first in the world to receive MasterCard PayPass technology enabling the device users to make in-store payments.
The sources put the slow development of NFC down to issues with standard specification, ecosystem and commercial operation.(source:mobile-ent)
6)Report: 1.2M Non-iPad Tablets Sold So Far In 2011
by Kyle Orland
While sales of non-iPad tablet computers in the U.S. have been steadily increasing throughout 2011, the market is still dwarfed by Apple’s market-creating device.
NPD’s new Connected Handhelds Report estimates that non-Apple hardware makers sold 1.2 million tablets from January to October this year, representing $415 million in sales. Those sales have been heavily loaded towards the end of the period, with third quarter sales six times larger than those in the first quarter.
Apple doesn’t separate out hardware sales by region, but it has announced the iPad sold over 25 million units worldwide in the first three quarters of 2011, suggesting a dominant position in the American tablet market.
Yet NPD’s survey suggests there is a segment of the market that can be won over to other tablet options, with 76 percent of other tablet purchasers saying they didn’t even consider an iPad.
Hewlett Packard led the U.S. market for non-iPad tablet hardware during the period, representing 17 percent of non-iPad tablet sales, largely thanks to clearance sales for its Touchpad after the line was discontinued this summer.
Other leading tablet brands included Samsung with 16 percent of the non-iPad market, Asus with 10 percent, and Motorola and Acer with 9 percent of the market. (source:gamasutra)
7)Android’s global share dips to 45% in October as iPhone 4S strikes back for Apple
by Matt Sakuraoka-Gilman
So many market share reports detail Android’s continued ascent that one suggesting the platform has suffered a slight dip tends to stand out.
That’s exactly the findings drawn from ad network Jumptap’s monthly MobileSTAT report covering the month of October, with the firm reporting around a 3 percent slump in Android’s global share to 44.7 percent.
The reason? Quite simply, the launch of iPhone 4S gave Apple a fairly hefty spike across the course of the month.
Indeed, iOS market share jumped to 24.6 percent in the latest report, with BlackBerry holding third spot on just under 23 percent.
To adopt or not adopt?
Aside from new hardware, however, one of the other major developments throughout the course of the money was the launch of several OS updates, including iOS 5, Android 4.0 and BBX OS.
Jumptap’s figures, however, suggest not all were adopted in equal measure.
It took iOS 5, for instance, 15 days to account for 32 percent of traffic. In comparison, Android version 2.3 took 10 months – until December 2010 – to achieve the same level of penetration.
Jumptap claims this is an indication of how little control Google has over its end user customers in comparison to Apple’s vertically integrated ecosystem.
“With lukewarm statements of upgrade support coming from OEMs, it is highly unlikely that we will see widespread adoption of Android 4.0 in 2012,” the firm added.
Head to head
On the hardware front, Jumptap claims it’s something of a more even contest between the two leading platforms.
Apple’s iPhone 4S managed a 33 percent day-on-day growth rate compared to the Galaxy S II on 32 percent. However, Samsung users access apps 27 percent more than their iPhone counterparts.
Samsung devices also register 37 percent more requests on the Jumptap network than iPhone, though iPhone users are twice as active on their devices than Samsung users.
“Gaming is the top content channel on Samsung smartphones, which is likely tied to the higher app usage we see and suggests a younger audience,” states Jumptap.
“For iPhones, News and Entertainment is the top channel, which may explain the prevalence of web browsing and suggests an older audience.
“The growth of the iPhone 4S suggests that owners of older iPhones – 3G and 3GS – are upgrading, while iPhone 4 owners are waiting for the next release.”(source:pocketgamer)









 闽公网安备35020302001549号