分享运用Excel和公式构建游戏系统的方法
游戏邦注:本文原作者是Jagex游戏工作室成员Claire Blackshaw,她在文中分享了使用Excel来帮助游戏设计的技巧。
我建议你寻找适合自己的探索方式,但我希望这一篇关注设计师应该知道各种工具或硬技术的文章——介绍工具或技术,希望能够激发你的兴趣。
Excel是设计师的实用工具。其实其他正规的电子表格软件也能替代Excel,甚至所具的功能比我所列举出来的还多,本文仅以Excel作为说明的案例。利用Excel不仅可以制作原型系统,还可以平衡和分析,从而构建出整个复杂的系统、模拟游戏系统。
公式(Formula)
公式是Excel的基础组成部分。以下是公式的速成介绍。
例子: =10 + 5 + C2 – SUM($A$1:D10)+Sheet2!A2
= 必须是第一个字符,用来指示它的公式属性。
10 你也可以在公式中使用“幻数”(游戏邦注:“幻数”是指公式或代码中的常数。之所以称之为幻数是因为它没有前后相关值和引用值。使用幻数,常常会使查看工作表的人对它的来源和前后关系产生迷惑。),但不推荐!除非有单元格注明你的逻辑。
+5 基础数学你懂的。在这里我们暂且不考虑微积分和统计学。
+C2 这是指从单元格C2中取值。比直接取常数或幻数好。
当你复制和粘贴公式时,程序会自动调整所有相关单元格的相对位置。所以如果你把这个公式复制到单元格D2,单元格C2会自动变成D2。
SUM() 这个函数的功能是合计一个或多个数字。Excel包括所有可用的公式。记住使用F1和谷歌,自动补充功能也相当好用。
$A$1:D10 这是表示一个包括所有从单元格A1到D10的范围,也就是4×10个数字块。“$”表示“绝对位置”。所以如果你复制粘贴这个公式到其他位置,$A或$1是不会改变的。
Sheet2!A2 这是指位于另一张工作表的一个单元格A2。
好啦,这就是公式的速成介绍。不明白的话就好好摸索Excel的使用。
命名单元格
没有名称或内容的东西最让人头大。设计工作簿经常变得乱七八糟。所以,如果一个单元格被引用到许多地方或不同的工作表,那就有必要命名这个单元格。当然,不一定整个工作表都有要命名。以下是关于命名的一般方法:
命名工作表:双击工作表名称
命名单元格:占击单元格的名称,在公式栏左边显示原名称的地方输入新名称。
命名范围:选择范围后,在公式栏左边显示原名称的地方输入新名称。
随机数
随机数总是很常用。
=Rand()
返回大于或等于0且小于1的平均分布随机数。
小贴士:平均分布随机数会根据重新计算而改变。用RAND随机取数后,要按F9保存,不然会随着表格的改变而变动。
VLOOKUP
VLOOKUP的功能是查找指定数值。它是许多公式的主干。最常见的用法是:将来源不同的数据放到另一张工作表上。
dir=”ltr”>VLOOKUP(lookup_value, table_array, col_index_num, [range_lookup])
其中,lookup_value 是搜索表区域首列满足条件的原素;table_array是确定待检索单元格在区域中的行序号;col_index_num是进一步返回选定单元格的值;range_loopup 是模糊匹配。(默认情况下,表是升序排列的)
特别注意:lookup_value必须位于数据首列,所以有时候你得重新排列数据。
数据透视表(Pivot Tables)
Excel的最大秘密!你可以选择一组已经存在于Excel中的数据,然后插入Pivot Tables;你也可以从数据源(如SQL)中输入数据。
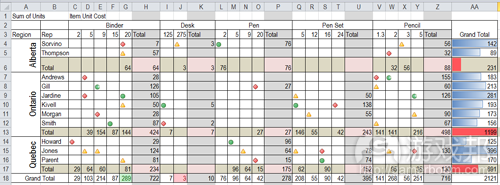
这样,你就可以组合数据和重定数据格式。多从网上摘录了一些案例以供参考。以下是一组连锁商店的销售数据:
OrderDate Region Rep Item Units Unit Cost Total
1/6/10 Quebec Jones Pencil 95 1.99 189.05
1/23/10 Ontario Kivell Binder 50 19.99 999.50
借助Pivot Tables,我可以在数秒内取下这组数据。
使用Pivot Tables,你可以快速获取数据摘要和分析。我严重建议你进一步学习相关的书籍。
单元格格式化
人类偏爱颜色。盯着一整页枯燥的数字对我们来说很无趣,所以最好把数字转化为图形或图表。有时候,条件单元格的格式化也有些用处,例如,快速突出高/低、相对值或指出最后或最前的10%。
这种快速视觉性参考点通常可以突出游戏系统的问题区。
小贴士:也可以将数字设成和背景一样的颜色,但显示格式化图标,这样可以缩小单元格。
Bins & Frequency
运用分段点(Bins )是一个数据分析的常用技巧,即将对象分成零散的小块,以加快运算和分析速度。例如,你正在研究玩家准确的击杀位置和死亡时间。你可以把时间轴分成小段(或Bins),将地图转化为网格(即分段X和Y轴),这样,你就得到了易管理的小数据块。
首先,你要定义Bins大小和范围。我建议用大小、最小值和最大值命名单元格,然后利用相对公式制成Bins范围。最后,选取出示结果的单元格,再运用以下公式:
=FREQUENCY(dataarray,binsarray)
小贴士:这是一个数组公式,所以请确保完成公式后按下CTRL + SHIFT + ENTER 键。如果操作无误,数字就会出现,{}表示这是一个数组公式。
结论:
我希望看完本文能激发你运用Excel的兴趣。多花点心思,你应该能够掌握使用Excel建模、平衡/分析系统、处理信息等的技巧。
最后小提醒一下:不要在Excel中构成整个游戏,这样只会引起时间浪费和混乱,但你可以模式化个别的系统。组合系统时,数据样本输出/输入通常很管用。
归根结底,所有游戏机制都是数定。在正确设置数值、不断改进系统和优化游戏等方面,Excel是最实用的工具之一。
附注:
我不排斥高级设计或全局观项目的要求,但不称职的人总是利用这些掩盖自己的无能。
团队当中有许多专业能手,在许多方面,他们比你更有时间和专门技术。努力理解他们的工作、支持他们,利用自己的知识提升设计,但不要越俎代庖。
所谓硬技术扎根于可靠的事实、实用的工具,至于沟通、交流产品风格这些软技术,其实往往更难掌握。(本文为游戏邦/gamerboom.com编译,如需转载请联系:游戏邦)
Opinion: Stop Being The Useless Designer – Excel and Formulas
by Claire Blackshaw
[In this technical, reprinted #altdevblogaday-opinion piece, Jagex's Claire Blackshaw offers some advice for being a useful designer and learning "Hard Skills", starting with the brick and mortar tool for designers: Microsoft Excel spreadsheets.]
Let’s face it, there is nothing more annoying than being bossed about by someone who is useless.?
So here are three simple rules.
Work with them in the trenches.
Everyone in the trenches has to be useful.
Supplement, don’t replace.?
So, acquire some “Hard Skills” fast and be useful. This is a multi-part post for some places to start developing those “Hard Skills”.?
Though I encourage you to jump into your own tunnels of exploration. I hope this is the first of a multi-part post focusing on various tools or hard skills for designers. Introducing a tool or skill, then getting you interested.
THE BEST PLACE TO START IS YOUR IN-HOUSE TOOLS!!!
Part 1: Excel & Formulas
Excel is the brick and mortar tool for the designer, though really any decent spreadsheet software will do and have most the features I list, so pardon the Excel centric explanations. With Excel, you can build entire complex systems and mimic game systems, allowing you to not only prototype systems but also balance and analyze them.
Formula Introduction
Equations are the bread and butter for Excel. So here is a crash course introduction.
=10 + 5 + C2 – SUM($A$1:D10)+Sheet2!A2
= must be the first character to indicate it’s a formula.
10 You can use “magic numbers” ? in your formulas, but DON’T! Unless it’s super obvious you’re better off using a cell reference to expose your logic.
+ 5 Most basic math can be exceled in excel formulas. We will leave calculus and statistical stuff aside for now.
+ C2 This references cell C2, pulling the value from that cell. This is better than using constants or magic numbers.
When you copy and paste a formula the program automatically adjusts all the cell references to their relative position. So if you copy this formula into the cell on its right C2 becomes D2. More help here
SUM() This function returns the sum of one or more numbers. Excel has a whole range functions for use. Remember to use F1 and Google, also the auto-complete is pretty awesome.
$A$1:D10 This is a range including all cells from A1 to D10 that’s a 4×10 block of numbers. The $ indicates an ANCHOR. So if you copy and paste this formula it won’t change $A or $1.
Sheet2!A2 This refers to a cell on a different worksheet.
Okay that’s a fast crash course introduction into formulas. Need more help? Head over to Excel Introduction.
Named Cells
Things without a name or context are extremely frustrating. Often a design workbook can become massive. So, if a cell is used in many places or referenced on different sheets, then NAME IT! It goes without saying your sheets should be named as well. This is the most common tip I give for Excel.
Naming a Sheet: Double click on the sheet name – Further Guidance
Naming a Cell: Click the cell name to the left of the formula bar. – Further Guidance
Naming a Range: Same as cell but selects a range.
Random Numbers
Random numbers are always needed.
=Rand()
Generates a random float between [0:1] from which all your calculations can flow.
Gotcha / Quick Tip: The random number changes every time Excel does an evaluation pass which you can force by pressing F9.
VLOOKUP Is Your Friend
VLOOKUP allows you to find data matching your request in a range of data. It’s the backbone of many of my formulas. The most common use case for this I found is when I have data from a separate source and I want to perform a bunch of lookups to bring data together on another sheet to add meaning.
dir=”ltr”>VLOOKUP(lookup_value, table_array, col_index_num, [range_lookup])
Using the lookup_value it finds the row in the table array then returns the Nth item in that row relative to the start of the table, based on col_index_num. range_loopup which allows you to have fuzzy matches.
One Gotcha is that the look_up value must be in the first column of the data, so sometimes you need to rejig you data a bit.
Further Guidance
The Power of Pivot Tables
Ah, the best kept secret of Excel. You can either select a bunch of data already in Excel and go Insert -> Pivot Table or you can just import from a Data Source like SQL.
Then you can group and reformat your data in ways which are so useful. Now I grabbed some sample data from contextures.com. It’s a bunch of sales data for multiple stores. Here is a sample cut out.
OrderDate
Region Rep Item Units Unit Cost Total
1/6/10 Quebec Jones Pencil 95 1.99 189.05
1/23/10 Ontario Kivell Binder 50 19.99 999.50
I can then take this data and with Pivot Tables see the following in a few seconds.
You can quickly pull out summaries and analysis on data with this tool. I strongly encourage you explore it further as entire books have been written on the topic. Feel the power of pivot ![]()
Further Guidance
Cell Formatting
Humans like color, seeing a page of number means very little to us. So wherever possible get things into graphs or charts. Though sometimes that’s not appropriate. In these cases, conditional cell formatting is your friend. It can quickly highlight highs / lows, relative values or just point out the bottom or top 10 percent for example.
This kind of quick visual reference point will often highlight problem areas in your game systems.
Quick Tip: Setting your numbers to the same color as the background preserves the data but brings forward the formatting icons, letting you shrink the cells.
Further Guidance
Bins and Frequency
Using data bins is a common trick in data analysis. By breaking things into discrete chunks for analysis, you can speed up calculations and perform analyses which otherwise would be difficult or impossible. For instance, say you are looking at a bunch of kill data for players which has the exact position and time of death. By breaking the timeline into chunks (or bins) and turning the map into a grid (breaking x & y into bins) you have group the data into manageable chunks.
First thing you will need to do is define your bin size and range. I recommend making a named cell for size (or step), minimum and maximum, then using relative formulas to make a range of bins.
Lastly, select the cells which will have the result and use this formula.
=FREQUENCY(dataarray,binsarray)
Gotcha: This is an ARRAY formula so be sure to press CTRL + SHIFT + ENTER when finishing the formula. If you’ve done it right your numbers will appear and { } will surround it to indicate an array formula.
Further Guidance
Conclusion
I hope your palate is whetted by this sample of the power of Excel. With a bit of thought, you should be able to model prototypes, mode balance systems, analyze your systems, process information, and help out in the trenches.
A last word of warning, do not try build your game in Excel. Such way leads to madness and wasted time; instead model individual systems. When looking to plug those systems together, often a data sample export / import is your friend. ![]()
At the end of the day, all your game mechanics boil down to numbers. Getting those numbers right, improving your systems, and optimizing are some of the best things you can do for your game, and Excel is one of the most fundamental tools in that arsenal.
Footnotes
#Please note: I’m not dismissing high-level design or the need to get an overview on the project but too often useless people use these as shields to hide incompetence.
#You have a team of specialists who will always have more time and expertise than you in many things. Look to understand their work, support them, and refine the design with your increased knowledge but never try do their job.
#Hard in terms of based on solid fact, brick and mortar stuff, as opposed to soft skills like communication and developing a feel for a product which can often be more difficult to master.
#Magic Number is a constant number used in line in a formula or code. Referred to as such because it has no context or reference. So anyone else looking at your work is immediate lost as to its source or context.
[This piece was reprinted from #AltDevBlogADay, a shared blog initiative started by @mike_acton devoted to giving game developers of all disciplines a place to motivate each other to write regularly about their personal game development passions.] (source:gamasutra)
上一篇:独立开发者自立门户前请考虑五件事


 闽公网安备35020302001549号