每日观察:关注智能手机及平板电脑网络流量(7.27)
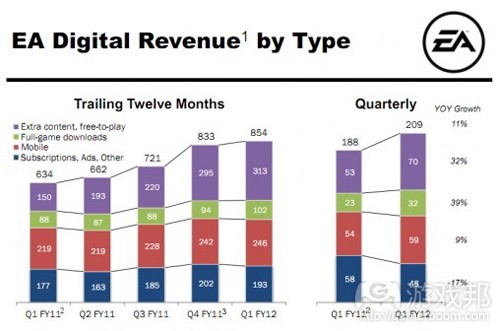
1)EA日前宣布在本财年第一季度(截止6月30日),公司手机游戏收益(基于非GAAP)比去年同期增长10%,共达5700万美元(游戏邦注:索尼PSP在同一时期的收益下滑42%,任天堂DS也下跌27%)。
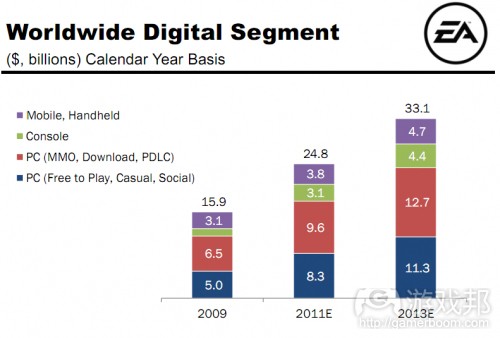
值得注意的是,该公司目前的手机及掌机游戏在其数字游戏收益中已经相当持平,EA所有业务的净收益为9.99亿美元,去年同期则是8.15亿美元;基于GAAP的净收入也从原来的9600万美元,双倍增长至目前的2.15亿美元。
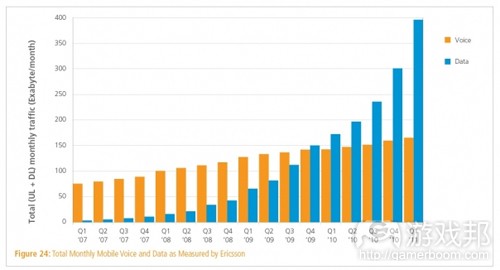
2)据Akamai和爱立信最近的调查报告显示,2011年第一季度,移动数据流量使用率比去年同期增长了130%;语音服务在无线网络的使用率低于数据流量。
报告数据表明,从Akamai网络的七个移动运营商来看,平均每名用户要消耗1GB以上的数据流量。这些运营商分别位于香港(平均消耗3.75GB/每月),印度尼西亚(平均消耗2.97GB/每月),法国(平均消耗1.42GB/每月),德国(平均消耗1.97GB/每月),斯洛伐克(平均消耗1.83GB/每月)、澳大利亚(平均消耗1.65GB/每月),波多黎各(平均消耗2.23GB/每月)。
其他调查数据包括:
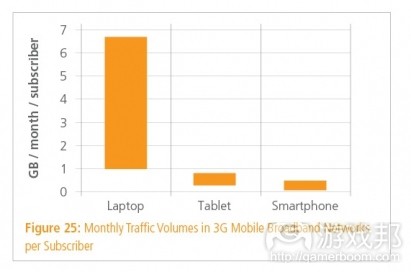
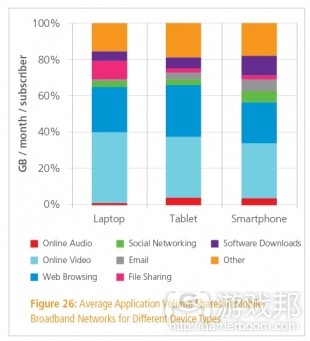
·笔记本电脑平均每月使用的3G流量最高(1至7GB),其次是平板电脑(250至800MB),智能手机居于第三位(80至600MB)。
·在线视频内容消耗了最多的移动数据流量(30至40%),其次是浏览网页(20至30%)。
·在平板电脑和智能手机领域,在线音频内容、电子邮件、软件下载、社交网络这几项行为,消耗了最多的3G数据流量。
·平板电脑和智能手机设备每天使用数据流量的频率较高,每次时间较短,有时也会呈现周期性的变化。
·笔记本电脑连接到移动网络的时间较长,主要发生在日间和夜间。
·平板电脑使用3G移动网络的规律与智能手机较为接近,与笔记本电脑的连网行为存在一定区别。
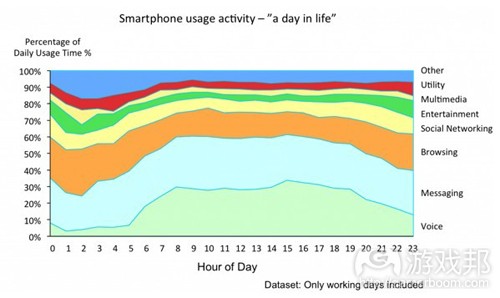
3)分析公司Zokem最新数据指出,智能手机在每个工作日的下午使用率最高,其中以语音通话服务最为典型;而在每天的其他时间中,包括应用程序和移动互联网在内的多项智能手机功能的使用率却较为均衡。
该调查将智能手机的使用率划分为浏览网页、信息服务(例如电子邮件、短信等)和语音通话三类。从下图中可以看出,在一般上班时间之外,应用和网络使用率高于信息和语音服务。在早上8点之前,下午6点以后,非语音和非信息服务的使用率占据了50%。
调查还发现,在周末时间中,人们使用智能手机的时间比平时推迟了两个小时左右,这表明人们在周末都喜欢睡懒觉。
4)Unity Technologies近日发布其3D游戏开发引擎的3.4版本,该版本工具添加了Allegorithmic的物体建型技术,支持Unity用户在小型文件夹中生成定制化的程序纹理,并在游戏运行过程中实时编辑这些纹理。
除此之外,该版本还更新了Unity编辑器,植入了Scene View图标和可更改的原始碰撞检测技术,并添加了可提高图像质量、渲染更迅速的优化代码,提供了下载内容的缓存支持。
5)Epic Games公司总裁Mike Capps在日前的媒体采访中表示,“99美分”休闲手机游戏将对《战争机器》这种AAA级“大制作”游戏带来威胁。他称自己非常担心这种价格低廉的游戏会冲击60美元游戏市场,但他认为99美分游戏,并不会危及《无尽之剑》这种高质量的iOS游戏,只是很怀疑次世代掌机游戏已经很难再说服人们为游戏投入60美元。
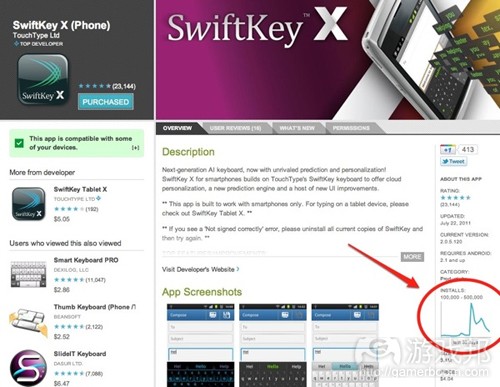
6)谷歌网页版Android Market日前又进行了一次小调整,添加了反映应用安装情况的图表功能。这些图表将显示安装数量至少达到1000次的应用,以及它们在过去30天中的安装次数,方便用户查看某款Android应用的人气指数或销售的波动情况。
但有观察者指出,谷歌的这一动作并无实际意义,因为该图表仅显示过去30天情况,而并没有反映应用安装比例,这样就很容易误导潜在用户,会让他们仅凭应用安装的曲线变化,放弃下载该应用或者对其产生不良印象。
7)据读写网报道,Adobe日前关闭了旗下两家手机及桌面应用商店Adobe InMarket和Adobe AIR Marketplace。Adobe表示他们是根据“开发者反馈”做出这一决定,公司将转向关注支持开发者面向多个平台发布应用的领域。
AIR Marketplace是一个面向终端用户的应用商店,支持用户使用Adobe AIR技术搜索应用程序,并鼓励开发者在该应用商店中自我推销产品,它包含一般应用商店所具备的图片、描述、评份、评价和社交分享等功能。
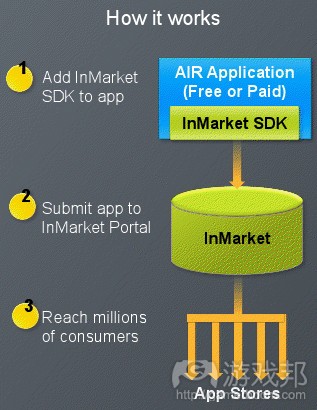
InMarket是一个针对开发者的应用销售渠道,支持开发者一次性向多个应用商店发布应用。Adobe去年才推出这个平台,当时仅支持面向英特尔AppUp应用商店(游戏邦注:专售Windows笔记本和上网本应用)发布产品,并曾计划在2011年下半年,将其支持平台扩大至10家应用商店。但不幸的是,根据InMarket FAQ资料显示,该平台现在所支持平台还是只有AppUp和AIR Marketplace。
这两个应用商店的开发者需在8月31日前下载自己的应用分析工具、营收报告等相关数据,英特尔也将在不久后向AppUp的相关开发者发送邮件解释其中详情。
8)Xcubelabs最近发布的信息图表回顾了Android崛起的发展历程。
Android最初由Andy Rubi、Rich Miner、Nick Sears和Chris White在2003年10月创建,其早期版本看起来与黑莓操作系统颇为相似,但iPhone问世后,Android迅速转变其关注焦点。
谷歌在2005年收购Andorid,并推出了Open Handset Alliance,在2007年11月发布了Android测试版SDK。Android历时将近一年才在手机领域站稳脚跟,当时的Android手机代表2008年9月面世的T-Mobile G1。
现在的Android已经摆脱原来的一款手机,一家运营商,几乎为零的市场份额这种窘境,成为占据最大市场蛋糕的智能手机平台之王。Android平台先后推出了Cupcake、Donut、Eclair、Froyo、Gingerbread和Honeycomb操作系统版本,其手机设备每日激活量已达55万部。(本文为游戏邦/gamerboom.com编译,如需转载请联系:游戏邦)
1)Electronic Arts’ Mobile Revenue Climbs 10% Year-Over-Year to $57M in First Quarter
By Kim-Mai Cutler
Electronic Arts said today that its mobile revenue climbed 10 percent from the same quarter a year ago to $57 million in the first quarter ending on June 30. At the same time, revenue from Sony’s PSP fell 42 percent and declined by 27 percent on Nintendo DS in another sign that the traditional console giants are losing power to smartphone platforms operated by Apple and Google. These numbers are on a non-GAAP basis, meaning they aren’t according to generally accepted accounting principles which would factor in acquisitions costs and stock-based compensation.
EA, which has been slower to adopt the free-to-play model than some of its smaller counterparts, said that it held two of the top 10 paid games on the iPhone and iPad along with five of the top ten paid games on Verizon in June. It hasn’t been able to have the same grip on the more closely followed top grossing charts, however.
Overall, one of the most interesting things to note is that mobile and console revenue are now roughly even as a share of EA’s digital revenue. The whole company pulled in $999 million in net revenue, up from $815 million a year earlier, according to generally accepted accounting principles. Net income more than doubled to $215 million from $96 million.(source:insidemobileapps)
2)Smartphones, iPads & the state of the mobile Internet
By Om Malik
Tweet inShare139The first quarter of 2011 turned out to be a big one for smartphone makers, especially Apple and Android-based device makers such as Samsung. In the US alone, slightly more
than half of the phones sold were smartphones, which now account for 80 percent of the revenues from phones sold in the US. Smartphones – along with the booming demand for personal hotspots, tablets and iPads — have caused mobile data usage to explode, increasing by 130 percent during the first quarter of 2011 versus the first quarter of 2010, according to Akamai and Ericsson. In comparison, voice is becoming less important on wireless networks.
In its first quarter 2011 State of the Internet report, Akamai presents some illuminating highlights about mobile data usage. For instance on seven mobile carriers, one user consumed, on average, more than one gigabyte of content from the Akamai network. The carriers were in Hong Kong (3.75 GB/month), Indonesia 2.97 GB/month), France (1.42 GB/month), Germany (1.97 GB/month), Slovakia (1.83 GB/month), Australia (1.65 GB/month) and Puerto Rico (2.23 GB/month.)
Other factoids from the report include:
The average monthly 3G traffic is the highest for laptops (1-7 GB), followed by tablets (250-800 MB) and smartphones (80-600 MB)
Online video (30–40 percent) is the largest contributor to mobile traffic volume, followed by Web browsing (20–30 percent).
On tablets & smartphones, online audio, e-mail, software downloads, and social networking traffic are big consumers of 3G data traffic.
Tablet and smartphone devices usually have frequent and short sessions typically during the whole day, sometimes showing a periodic nature.
Laptops are usually on mobile connections for a few longer sessions, mainly during daytime and the evening.
Tablet traffic patterns over 3G mobile networks are much closer to smartphone traffic patterns than to laptop traffic patterns. (source:gigaom)
3)Chart of the Day: No Primetime for Smartphones
By Sarah Perez
Analtyics firm Zokem recently released data related to smartphone usage trends, based on its panel of global studies involving consumer behavior. The goal was to identify mobile consumer trends as related to smartphone enagement.
The company found that there is a slight peak in the afternoon on work days, related to an increase in voice calls. But for the rest of the day, engagement with different smartphone features is fairly even, including both app and Internet usage.
The study broke down the different applications into categories, and compared those with Web browsing, messaging (e.g. email, SMS, etc.) and voice. The chart below shows that, outside typical office hours, both Interent use and app use are more popular activities than messaging and voice. In fact, before 8 AM and after 6 PM, non-voice and non-messaging activities take up 50% of total smartphone use.
The only other notable finding was that on weekends, usage starts a couple of hours later, indicating that people like to sleep in!(source:readwriteweb)
4)Unity 3.4 Release Brings Promised Allegorithmic Substance Integration
by Kyle Orland
Unity Technologies has released version 3.4 of its widely used 3D game creation engine, adding features including integration for Allegorithmic’s substance modeling technology.
The Allegorithmic integration, first announced last October, brings Unity users the ability to generate customizable procedural textures in very small files, and edit those textures in real time as the game runs.
The new version also updates the Unity editor to include Scene View icons and modifiable primitive colliders; includes optimized code for better visual quality and faster rendering; and adds caching support for downloadable content.
Looking forward, Unity CEO David Helgason said the company is planning to “continue adding support for bigger projects and larger teams” as well as add new optimizations and editor features.(source:gamasutra)
5)Epic: Mobile Games a Threat to Triple A Games
by Alex Co
Epic Games boss, Mike Capps thinks that the sudden boom of cheap, casual mobile games could be damaging for the next-generation of gaming.
In an interview with IndustryGamers, Capps remarked that “99 cent” games pose less of a threat to “big-budget” iOS releases like Epic’s own Infinity Blade, than they are to triple A games like Gears of War.
I’m more worried that you can get a really good 99 cent game that occupies you for hours and hours on end and how that impacts $60 SKUs
I’m not as worried about how it impacts Infinity Blade – I think there will always be room for a premium SKU on a mobile platform. And I think as more buyers [enter the mobile market], there will be more people who are willing to spend a bit more for quality
But I do worry about what it means for the next generation of console games. Are people really going to want to spend $60 on a game?… It’s not a sustainable business model. I’m not sure how it all ends up Capps does make a very good point. Will gamers feel comfortable parting with $60 of their hard-earned money for a single game knowing that there are “lesser” alternatives that cost a whole lot less?
While a lot of people dismiss mobile gaming as something that only caters to the “casual” sector, don’t forget that we didn’t have this kind of mobile technology a few years back. What if the next wave of tablets, mobile phones and the like, are powerful enough to produce PS3-like visuals and gameplay?
It’s certainly food for thought and what Capps stated is something that a lot of videogame publishers agree on – a perfect example would be EA’s acquisition of PopCap Games.
Will the next-gen of videogaming feel the brunt of mobile games or will there always be a significant market for $60, triple A games?(source:vgchartz)
6)Google Adds Installation Graphs to Android Market
By Sarah Perez
Google has made a small change to the Android Market on the Web involving the addition of installation graphs. These new graphs show up only for apps that have been installed 1,000 times or more, and show the number of installations over the past 30 days.
This lets customers easily see if an Android app is increasingly popular, has steady sales, or peaked then dropped off quickly, which could indicate problem.
Incremental Improvement or Source of Confusion?
The change was first spotted by the folks over on PocketNow, who felt that the addition may not be particularly practical. Commenters there agree, noting that beyond saying “past 30 days” on the bottom, the graphs have no scale to them.
It’s an odd choice from an organization that prides itself in dealing in data. Without a scale, the graphs could actually confuse potential customers, who may see drops and dips or flat lines, and think the app should be avoided. If a scale had been provided, the graph could have shown the app was getting thousands, or tens of thousands, of sales over the past month. Any drops and dips may have been only minor bumps when presented with the overall size of that month’s install base.(source:readwriteweb)
7)Adobe Shuts Down Its App Stores
By Sarah Perez
Adobe is shutting down two of its app stores dedicated to mobile and desktop application distribution, Adobe InMarket and the Adobe AIR Marketplace. The decision, the company says, was based on developer feedback. Adobe says it will now focus its efforts on helping developers publish their apps on multiple platforms, including official app stores like Apple’s iTunes, Google’s Android Market, BlackBerry App World, Intel’s AppUp, Samsung Apps and Toshiba App Place.
AIR Marketplace for Consumers
The two stores served different purposes for Adobe. The AIR Marketplace was a consumer-facing effort where end users could search for and discover applications built using Adobe AIR technology, like TweetDeck, AccuWeather’s alerts app, AOL’s Top 100 Videos or a Facebook Photo Uploader, to name a few of the more popular items. Developers were encouraged to list their apps in this store for self-promotional purposes, and it included typical consumer app store features like images, descriptions, ratings, reviews and social sharing options.
InMarket for Developers
Meanwhile, Adobe’s InMarket was an app distribution service targeted towards developers. The idea here was that developers could publish once to distribute everywhere.
Adobe launched the store last fall, when it only supported publication to Intel’s AppUp center, a Windows app store designed for netbooks and notebooks. At the time, Adobe said that it expected to support 10 stores by the second half of 2011. Unfortunately, that did not happen. According to the InMarket FAQ, only AppUp and Adobe’s own AIR Marketplace were supported. This makes it seem as if the store’s shutdown had less to do with “developer feedback” and more to do with Adobe’s failure to secure app store partners as promised.
Developers have until August 31st to download their app analytics, revenue reports and other data, and update any widgets or links to their app’s webpage. Developers who published to AppUp will receive an email from Intel over the next few days with more details about direct publishing.(source:readwriteweb)
8)Witness the rise of Android
By: Marin Perez
It’s been a magical ride for the Android operating system, as it wasn’t too long ago that analysts were insisting that Google was crazy to enter into this space. Now, Android has some incredible momentum in the market and the folks from Xcubelabs have put together a neat infographic about the rise of Android and its major accomplishments.
It starts out with the founding of Android by Andy Rubin, Rich Miner, Nick Sears and Chris White in October 2003. Those of you who follow these things closely will remember that early versions of Android looked very similar to the BlackBerry operating system. Once the iPhone came out and was a hit among the tech crowd, Android quickly changed its focus.
Google purchased Android in 2005 and rolled out the Open Handset Alliance and the Android beta SDK in November of 2007. It took nearly a year for Android to land in a handset, as the T-Mobile G1 landed in September 2008.
From those humble beginnings – one device, one carrier, near-zero market share – Android has rocketed to the top of the smartphone charts in terms of market share. With Cupcake, Donut, Eclair, Froyo, Gingerbread and Honeycomb, the platform has gotten much better with each iteration and it has resonated with consumers, carriers and handset makers all over the world.
Google recently said it is activating 550,000 Android handsets a day and look for that number to continue to rise. (source:intomobile)










 闽公网安备35020302001549号