


解析iPhone应用销量趋势的计算公式
游戏邦注:本文作者为William Volk,文章通过举例分析,呈现iPhone应用的销量趋势,原文发布于2011年4月18日,涉及数据以此为准。
在iPhone应用营销活动中,把握应用描述、游戏截屏、营销活动和公共关系带给应用销量的影响颇有益处。而最好的方式就是观察上述内容的变化是如何影响应用日常下载量。
这个方式存在一个问题。开发商早就心中有数的是日常下载量会出现变化。例如:若开发商周五改变应用描述(游戏邦注:应用商店当中的)的某个截屏,那么周六销量增加10%是好是坏呢?还是仅仅表明相比周五,周六下载量更高?
开发商可把该数据同上周做比较,但这呈现的可能是更大趋势。若开发商不断调整内容,那么最好将销量/下载量进行日常比较。这样我们便能判断应用下载量的每日趋势。
首先就以1月份发行的热门免费游戏《Bocce-Ball》为例。《Bocce-Ball》在众应用中名列第六,且游戏在促销和广告活动结束后,下载量仍旧相当可观。更重要的是,游戏内容已经几周没有更新,所以我们有望看到稳定的日常下载量,以及明确日常销售模式。该游戏当前的每周下载量依旧相当稳定。
这些日常下载量数据覆盖的时间范围是2011年2月28日-2011年3月10日。我们把游戏每周下载量设定为标准值700次(游戏邦注:即每天100次),然后观察游戏在6个工作周内的每日变化趋势。数据采集完毕后,我们去掉两周明显偏离标准值的数据,然后得出如下结论:

Chart 1 from Gamasutra.com
以表格形式呈现就是:
周一 周二 周三 周四 周五 周六 周日
103 95 92 94 93 112 114
令人惊讶的是,该模式的整组数据值偏差极小:
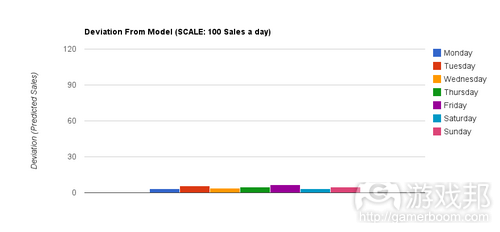
chart 2 from Gamasutra.com
平均偏差值约为4次。即便将较大偏差数据囊括在内,平均偏差值仍旧低于5次。
为检验结果,我们使用相同衡量方式观察6周的数据,看看差距是否明显(游戏邦注:原先排除在外的两周数据也囊括在内)。测量值和偏差依旧显示,这个模式是观察日常销量的准确模式。平均值为:
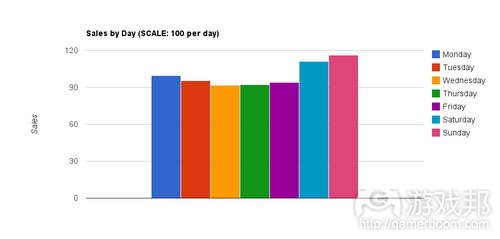
chart 3 from Gamasutra.com
之前模式(采用相同测量标准)的偏差值(源自新平均值)是:
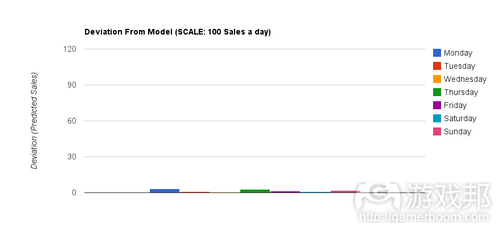
chart 4 from Gamasutra.com
这说明什么?
我们把实际测量值除以测量值就能算出日常数据,将日常销售数量标准化。例如,若游戏周五下载量为6000次,周六增至6500次,则周五和周六的标准测量值分别是6451次和5803次。标准测量值=实际测量值/模式当日数据。日常销售模式数据表明,鉴于周五下载量为6000次,所以若其他因素保持不变,那么周六销量应为7226次。
所以在文章开始的例子中,游戏截屏变化导致周六下载量相比周五增长10%(游戏邦注:假设从6000次到6600次)……修正结果是,当日常趋势充当标准值时,下载量其实降低8.6%,因此最好还是使用原来的游戏截屏。(本文为游戏邦/gamerboom.com编译,如需转载请联系:游戏邦)
Daily iPhone App Sales Trends
by William Volk
In marketing iPhone apps it is useful to see the effects of app description, screen shots, advertising campaigns and public relations on the sales of your app. The best way to do that is to see how these changes effect the number of downloads you are seeing on a daily basis.
There is a problem with this approach. What developers have long observed is that download volume varies, based on the day of the week. For example: If you changed a screen shot in your app description (on the app store) on Friday, is the 10% increase in sales on Saturday (compared to Friday) a good or bad thing or just a reflection of more downloads on Saturday vs Friday?
You could always compare the sales numbers to last week, but that could reflect larger trends. If you are making frequent changes it’s good to have a way to compare day to day sales/downloads. So we set out to determine the day to day trends for app downloads.
We started with a free popular game that had been released in January, Bocce-Ball. Bocce-Ball had hit #6 in all apps, and was continuing to see a good number of downloads even after promotions and advertising had stopped. What’s more, we were weeks away from an update so we believed we would see consistent download numbers and definite patterns emerging on the sales based on the day of the week. The weekly download volume remained relatively stable during this time.
We used the daily download numbers starting on Monday Feb. 28th (2011) and ending on Sunday March 10th. For each week we normalized the numbers to an average of 700 downloads a week (100 per day) and looked at the daily trends for these six working weeks. Once that data was complied, we removed two of the weeks with the greatest deviation from the norm from the analysis and came up with the following results as represented by these graphs:
In tabular form this came out to the following matrix:
Monday Tuesday Wednesday Thursday Friday Saturday Sunday
103 95 92 94 93 112 114
What’s surprising was how small the deviations for the entire data set were from this model:
The average deviation was approximately 4 downloads (normalized). Even with the ‘bad’ data folded back in, the deviations are still under 5 downloads on average.
As a check, we ran the same measurement for all six weeks to see if the model deviated greatly, even with the two previously removed weeks added back in. The values and deviation still indicated that the model was an accurate model of sales by day of the week. The averages were:
And the deviation (of the new averages) from the prior model (at the same scale) is:
What does it mean?
The implication is that you can scale your daily numbers by the inverse of these values to normalize sales number by day of the week. For example if you saw 6000 downloads on Friday and then 6500 downloads on Saturday, the normalized values would be 6451 and 5803 for Friday and Saturday respectively. Normalized Value being equal to the Actual Value divided by the model’s number for the day (as a %). The model for sales by day of the week would indicate that the sales for Saturday, given 6000 downloads on Friday, should be 7226 if all other factors remained the same.
So in the example given at the start, a change in a screen shot resulting in a 10% increase in downloads from Friday to Saturday (say from 6000 to 6600 downloads) … the corrected result is actually a 8.6% decrease in downloads when the day to day trends are used as a normalization. Better go back to the original screen-shot in that example.(Source:Gamasutra)

")
")
")
")


