解析社交游戏《Cityville》前4级的游戏机制
作者:Aaron H.
Zynga旗下的《Cityville》是第一款曾吸引1亿多名月活跃用户的社交游戏。虽然很多人惊讶于这款游戏为何能够如此快速地取得这么好的成绩,但是它的成功却使社交游戏行业迈向了更高的一个层次。从此,那些像MMO这类较为正统的游戏玩家以及开发者都开始对社交游戏领域刮目相看了。
从《FarmVille》到《FrontierVille》再到最新的《CityVille》,在Zynga的这一系列受欢迎的游戏中,不断出现了一些新的游戏机制。Zynga一直致力于为玩家开发更深层次的游戏玩法。如今的市场有许许多多社交游戏公司在竞争着,所以当思考日活跃用户或者月活跃用户粘性的同时,游戏公司应该更多地关注如何加强用户的粘性以及用户留存率的问题。
Digg创始人Kevin Rose发表了一篇以《CityVille》为主题的博客,他认为“我们将重新定位这个分析,着重考虑要如何在我们自己的‘仪表盘’里设置并分析这些分散的机制目标。”
游戏机制
所有社交游戏都必须为玩家设立明确的游戏目标,因为如果在游戏中玩家没有任何目标,只是盲目地进行游戏,那么他们将会很快对游戏失去兴趣。不论这个目标是能够帮助玩家获得奖励,游戏升级还是提升他们所处社区的价值,所有社交游戏的开发者都应该对此报以重视。我在《Cityville》中已经达到了4级,并且已经找到了4种不同的目标机制了,所以我已经有资格建造属于自己的虚拟‘市政府’”。以下则是我所列出的4种目标机制。
病毒传播机制:鼓励玩家邀请朋友并以此获得奖励的方法,提高了游戏的知名度。
用户粘性机制:通过对游戏玩法的设置,推动玩家在游戏中的游戏进展,并以此加深他们对游戏的粘性。
用户留存机制:通过邮件和通知等方式,在玩家结束一款游戏后,迅速地将其再吸引回来。
病毒式粘性机制:在这个领域里,玩家不只要努力完成游戏中的目标,还应该积极帮助他们的朋友或社区里的邻居,并支付宝贵的虚拟游戏币以完成游戏。
我并未将交易机制归入于上述的例子中,因为它将有可能被认为是用户粘性机制和病毒式粘性机制后最有潜力的收益来源,尽管玩家在免费游戏中并不需要支付任何费用(但是Zynga却非常希望玩家能够支付游戏费用!)。在这一些中,我们将深入挖掘利润受益的能见度。
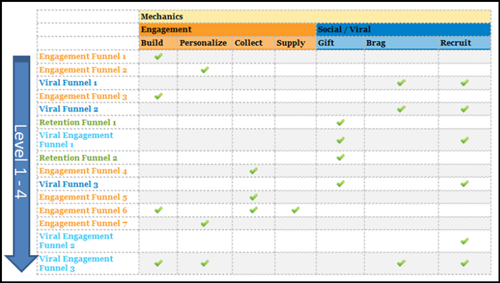
下面的表格中,Aaron H列出了他是如何在达到4级成就时破解游戏中的目标机制的。用户粘性能够有效地分解游戏机制,而社交游戏机制或者病毒传播机制则一直贯穿于整个游戏过程中。
观察:
在《Cityville》的前面几个级别中,病毒式目标机制占多数。因为Zynga知道游戏开始的前15分钟对于保证用户粘性是非常重要的。即使这些玩家不再玩这款游戏了,Zynga也希望他们能够邀请朋友,或者告知朋友这款游戏的存在,为Zynga带来一些潜在的玩家。
游戏开发者在游戏的前面几个级别中设置了较为简单的用户粘性目标机制。Zynga知道玩家渴望成就感,并且希望能够轻易地获得归属感。所以游戏前面的几个用户粘性目标就成为了必不可少的新手教程,开发者通过奖励那些完成游戏目标的玩家(游戏邦注:让他们有机会能给自己的城市命名等),以巩固他们对这个虚拟城市的内心归属感,并鼓励他们对其进一步投资建设。
随着游戏的深入进行,病毒式粘性机制的出现将越来越频繁。这个游戏的转折点是,当玩家能够建造属于自己的“市政府”时,标志着他们的城市已经从原有的小规模扩展成为一个较大规模的城市了。当玩家达到这个级别时,他就必须“雇佣”他的朋友或邻居,或者花费City Bucks去雇佣Samantha(游戏邦注:该游戏的NPC角色)前来“市政府”进行管理。设置这种病毒式粘性机制是《Cityville》目标机制的创新所在,同时也可以说是这款游戏设置的智能进化。不管玩家选择病毒式机制还是交易机制,最终结果都是一样的,他们将对朋友发出邀请,随后又会通过付费途径加快游戏进程,因为他们没有耐心去等待朋友们伸以援手。
Part 2:用户粘性目标机制
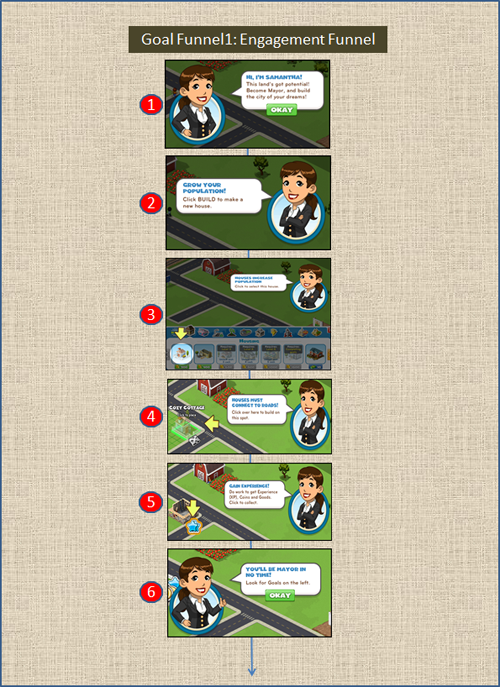
新手教程就是一个很好的案例。很多社交游戏都有一个专门的新手教程,以此帮助玩家达到游戏中的目标,并在游戏最后给予他们奖励。使用新手教程还能够帮助游戏吸引更多的初期玩家。《CityVille》需要玩家实现的第一个目标是建造一所新房子。我们能够通过分解这个机制找出游戏开发者的目的,即他们想借此了解并优化他们的特定用户粘性机制,激励更多玩家完成游戏目标并参与进一步的挑战。
通过上图的用户粘性机制描述,我们可以看到,游戏开发者要想从我们的平台上获取相应的观察结果和行动共需要两个步骤。在我们的平台上有一个API调用示例能够展示API调用的简单结构,同时还有一些参数作为优化服务器的参考。通过使用这些API调用,我们能够进一步发现利润收益的能见度,并深入观察社交游戏的相关分析,从而采取可能的行动。
用户流
A.配置
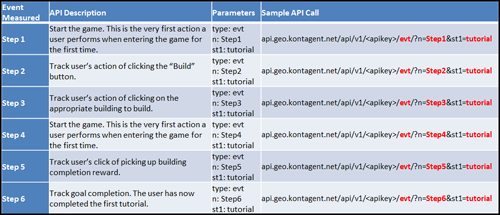
从以下的表格我们能够知道《CityVille》的开发者是如何通过Kontagent(游戏邦注:社交分析平台)的API调用掌握详细的用户流的。
API调用是个相对简单的过程:能够让我们知道玩家进行到游戏的第几个级别。在上面的表格中,变量“n”代表的是事件的名称,而参数“st”则是表示子类型。玩家可以使用3个子类型(如上指示的步骤1,步骤2和步骤3)以特点的属性去标记那些事件的名称。如果你用“新手教程”去标记事件的名称,将能够帮助你在自己的事件列表中搜索到相关新手教程步骤。
B.研究和行动
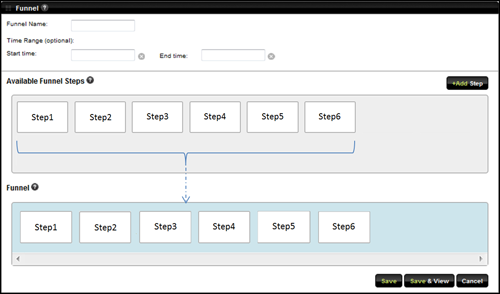
一旦API调用设置完成后,我们能够在特定的事件仪表盘中看到相应的事件。从这里我们能够看到任何下降的用户流信息。
使用拖放功能可以随意搭配出任何可能的自定义事件组合。
结果机制能够帮助我们清晰地看到用户流的变化,并通过过滤器将其限制于独立的“时间”,“年龄”,“性别”,“朋友数量”以及“位置”窗口中。举个例子来说吧,如果一名18至25岁的美国男子或加拿大男子完成了游戏新手教的的初级任务,你就可以使用过滤器去获得相关的能见度级别。
根据用户粘性机制流,我们可以看到在步骤1和步骤2阶段,用户下滑的百分比是非常明显的。这种情况在社交游戏的目标机制中很典型,因为通过这种机制,玩家会越来越渴望完成游戏中的目标以此达到晋级,而随着他们级别的上升,将会有越来越多的用户开始进行接下来的几个步骤。因此,优化前面两个步骤以抑制用户下滑这一点十分关键。你优化的机制级别越高,就意味着越理想的用户转化率。在此,你可以在系统中对用户进行分类,并按以下几点对其进行测试:
1)减少或增加游戏步骤
2)通过上述A和B的信息测试,优化步骤1到2的用户下滑情况
3)在应用内嵌框架中测试新手教程窗口的位置(游戏邦注:例如将其设置于你想让用户按压的实际按钮附近,或者远离“exit”按钮)。
自定义目标和用户粘性
A.配置
通过如下使用案例,我们可以追踪自定义目标以确认新手教程的完成度和用户登录时间的长短。
你可以在这个系统中使用4个自定义目标(gc1-gc4)。在这里,我们设置gc1参数以表示新手教程的完成度,即新手教程步骤的完成数量是1。因此,这个系统会标记出每一个目标的完成,以此作为一个渐进的数目。用户粘性API信息本身也附有一个时间参数,因此我们可以定义每一个玩家登录系统的时间长短。
B.研究和行动
每小时的能见度:自定义目标能够帮助你更好地观察应用的检测点。除了经常使用的“年龄”,“性别”,“朋友数量”和“位置”过滤器外,你还可以开发一个“每小时数据”,以观察用户在一天中的哪个时间段最有可能完成新手教程中的自定义目标。除了所有安装数量外,很多媒体采购员已经开始通过自定义目标计数更好地判断他们的广告购买情况。媒介导购员普遍想知道的情况之一就是,有多少用户在安装应用之后完成了新手教程的任务。如果你发现用户数量较少,并且你还未调整市场营销策略,这种能见度将能够帮助你判断一天中不同媒体的用户关注情况。如果玩家完成了一个新手教程任务,他们对于这款游戏的粘性将大大提高,同时也将带给这款游戏带来更高的留存率和交易量。
使用Traffic标签,媒体采购员能够通过他们的广告活动和广告变体进一步优化他们的标价,并为合作者提供更有效的CPI。除了我们的Traffic标签中所显示的1至7天中的用户留存率和增加系数,新手教程完成度的自定义目标计数能够用于检测用户粘性,以帮助他们确定最适合的标价。
用户粘性统计,包括计算每个用户平均登录的时间(长短),能够帮助你评估用户对于游戏的热衷程度。配置“pgr”的API调用能够帮助更好地观察用户平均登录的时间。如果用户粘性变强了,他们每次登录的时间也会随之变长,这说明该款游戏的游戏机制做出了相应调整,能够更好地配合用户的游戏体验。要时刻密切观察对用户平均登录时间长短,通过用户粘性机制优化游戏机制能够帮助开发商避开风险。像《CityVille》游戏新手教程中的用户粘性机制,可为玩家创造出更加多彩的游戏环境,使其深陷于游戏世界的魅力中。
Part 3:病毒式传播机制
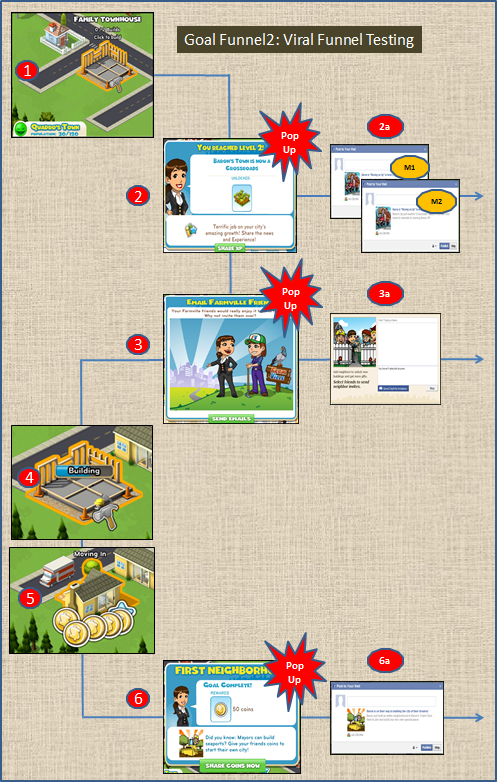
一系列的病毒式传播机制可以在不同的点和标准下测试,下面的流程就是一个很好的例子。用户进入游戏后的首要任务是建造房屋和街道,建造房屋使用户们熟悉建造的特征,同时也消耗了能量和游戏币。用户必须频繁的点击来建立一个建筑物,越大的建筑需要越多次的点击,同时也需要消耗更多的能量和游戏币。以下是我采取的具体行动:
1.在安置好住宅楼的位置后,我升到了第二级,并选择向朋友们炫耀。(Viral Funnel1) [Diagram: 2 - 2a]
2.如果我点击了病毒式窗口上的关闭按钮,另一个弹出式窗口将会出现并发送电子邮件给我的朋友。viral
3.如果我点击了关闭按钮并完成了住宅楼的建造,界面也会弹出一个让我向好友们晒出游戏成就的窗口。(Viral Funnel3) [Diagram: 6 - 6a]
所以,随着第一个任务的完成,我将有3次机会可以推动这种病毒式传播。
采用以上的流程,我们将展示更多社交分析仪表盘的功能。由于《CityVille》是运行于Facebook的游戏,所以我们接下来将探索多种病毒式传播渠道。
用户流
A.配置
下面的表中所列事件显示了人们是如何通过每一个步骤以得到正确的用户流观察结果。St1代表的是事件的子类型或者特定事件的属性,被设置为“建造房屋1”。这个事件的属性参数会传送到我们的服务器,我们可以从仪表盘中看到它的结果。
API Calls:
现在,我们可以研究为什么拖曳功能在病毒式机制如此重要。
B.研究和行动
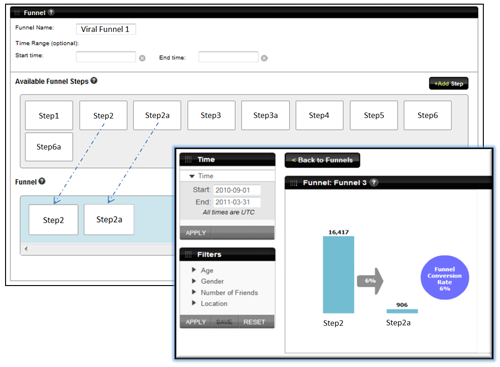
在游戏设置中一个最有力的工具就是能够创建自定义机制。假设你已经配置了以上所有的自定义事件,你就可以看到机制步骤列表中的每一个事件。现在,你所需要做的只是将步骤拖曳到机制界面中来观察用户流失率。因为我们已配置了自定义事件,可以用机制分析标签来看这三个病毒式传播机制和流失率。
简单的拖曳可以为每一个病毒式机制创造出新的机制。
比较这三种病毒式机制的流失率。病毒式机制中的用户流测试2也许比3更有意义?你可以在自己的服务器上做一个用户分类来看我们仪表盘上的结果。
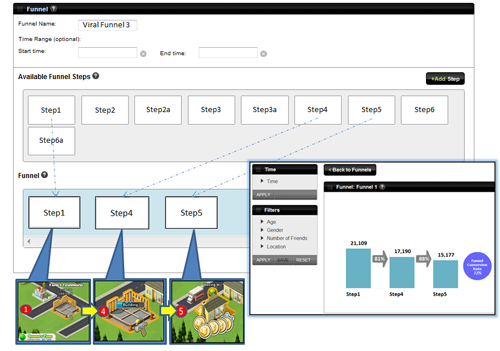
你甚至可以看到粘性机制通过拖曳步骤1,4和5来看流失率,以及那些已经完成主要预设目标的用户最终转换率。在这里,你还可以测试并观察到是否增加或移除病毒式机制或者增加在预设机制目标的步骤,来增加或降低那些已经完成建造街道的用户百分比。
A.配置
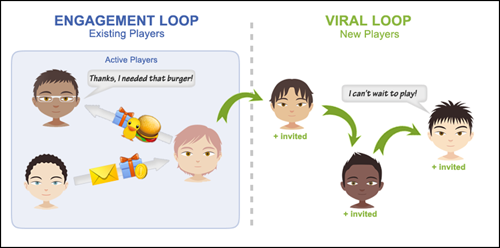
以上的用户流有三个可以发送病毒式渠道的机会,下面的事件是以API调用确认病毒式渠道的可见度,例如电子邮件和贴子。从那里你可以看到比我们关于用户流初试的更多参数。这个的社交分析没有用到这些信息记录程序。因此,当使用仪器调用和测量病毒式邀请的反应率,我们总会使用在API调用里的独特跟踪参数(U参数)来匹配发送/回应的讯息。(见下表中的PST/PSR事件类型讯息)此外,我们使用独特的收件人ID(R和I参数)来确认有回应病毒式讯息的玩家是否是现有玩家。病毒式循环和预定式循环可以被简单的定义为以下两种:
●病毒式循环——给还未安装这款游戏的用户发送邀请或者讯息。
●重复粘性/留存率循环——给已经安装这款游戏的用户发送邀请或者讯息。
我们已经在这里利用了ST(图表类型)参数来作为我们过滤掉的事件的标签属性。尤其是步骤2a显示了在上图的第一个病毒性机制的用户流A/B传播测试。[Diagram: 2 - 2a]
为了在每条信息A/B测试中看到回应率,我们利用st2和标记相应的信息为M1或M2。
API调用:
B.研究和行动
让我们来看看如何把仪表转换为仪表盘观察结果。病毒传播事件API调用会显示在病毒式标签中。在这里,你可以看到所有重要的K系数。曾有许多人认为病毒式传播渠道已消亡,但是在Facebook,病毒式渠道还会再度复兴。
在2010年9到10月份左右,K系数已从低谷逐渐上升,我们已看到Facebook企图重振其病毒式传播渠道,也许他们也开始意识到Facebook过于压制病毒式渠道。
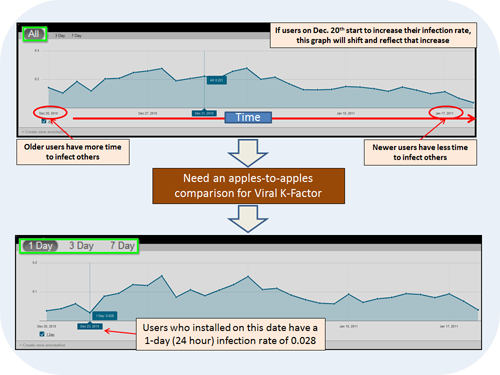
真实的病毒式传播渠道:真实的病毒式传播渠道是Kontagent的独特理念,他们投入大量研究以向游戏开发者证明病毒式传播的可行性。下图概述了真实的病毒式传播理念并展示了为何它是一种获得可行的较好方式。为什么要关注病毒式传播在第1,3,7天的增长?除了正常的视图,也就是我们所说的真实的病毒式传播,K因子将持续下滑(向下倾斜?),因为大多数新用户不像老用户拥有那么多机会来影响(邀请)其他用户。
为了在一个规范化的基础上看到病毒发展趋势,开发者用一个时间切片来查看K系数的趋势是至关重要的。每一个在1,3,7日的点都代表了当日安装了应用的用户队列。例如,1日的病毒式传播的病毒式系数会在用户安装后24小时出现。 真正的病毒式传播基本上消除了暂时性的病毒式传播效应。
即使去年病毒式渠道已经不那么有效了,它们还仍然可以分辨出成功的用户获取战略和亏本生意的差别。从下面的截图中,开发者可以看到1,3,7日的真正病毒式传播情况。7日的病毒式传播可以更好地分析邀请发送结果。用户回应邀请信息通常比邮件或发贴需要更长的时间。
此外,该病毒式仪表板会显示每名用户的平均邀请发送次数(或者的用户的病毒式传播度)和接受率,也就是你的邀请发送转换率。你还可以看到病毒式信息发送和回应的总趋势。
最后,通过M1和M2的A/B病毒式信息测试,你可以看到下面表格中我们的病毒式仪表盘结果。A/B测试总结表格显示了病毒式发送邀请的接受(点击)和接受率。
正如你所看到的,有无数方法可以让游戏开发者获得至关重要的洞察力。根据开发者所需获取的独特游戏机制能见度,社交分析平台可提供足够的灵活性来处理多种使用案例。我们将从四个部分来检验《CityVille》中的其中一个留存率机制。
Part 4:粘性目标机制
留存率/重复粘性机制是一种保证目前玩家黏性的有效方法,留存率机制的特征如下:
1)原有用户发送的邮件或广告,可以增加游戏或应用对新用户的粘性。
2)为用户提供奖励,让他们加快游戏进程。
以下的留存率机制可看作是一个典型的粘性流程,但游戏机制和最初步骤是不同的。第一步是发邮件给用户诱使他回来收集每日奖励[步骤1]。这些约定机制被称为一个成功游戏的重要机制。
每天都应该不断提供更好的奖励给那些返回来体验游戏的用户。事实上,一旦用户对邮件有回应,第一个诱因已经成功提醒用户了,他们应该在接下来5天连续玩游戏以赢取奖励。[步骤2-2a]
因为第一天之后用户留存率就会急剧下降,所以在用户安装和体验游戏后,第一天的吸引用户回访游戏的活动就变得很关键。奖励不仅可以吸引玩家回到游戏中,很多玩家回到游戏中后会使用他们所获得的虚拟货币,很多复杂的游戏机制还能让玩家随着游戏进程的深入,逐步创造社会资源并让自己沉浸在游戏中。
下面的目标机制图显示了两个病毒传播机会;只要用户一开始回复邮件就能收到奖励,此外在目标机制的最后环节[Step6-6b],一个只需两步便可完成的步骤是为了让用户获得更多的虚拟资源。让我们来检查这个用户流的可行性。
用户流
A.配置
在前面的帖子里,我们跟踪信息的evt并作为粘性机制的部分内容,也在适当的地方跟踪病毒式传播步骤。就动机而言,这个用户流的目标是一样的:让用户完成一定的目标和进程,来拓深他们的社交粘性。这里的重要目标和奖励都很常见,在特定的目标流程里还发生两次。此外,这个流程的目标是简单收集更多能在游戏里使用的虚拟商品。
这种设置的一个重要提示点是,使用st2可以生成更多参数。在steps 2-2a和steps 6-6b里,st2可测试用户发送重要信息的愿意有多强烈。我们可以使用st1,确保我们可以对贡献的参数进行会合,以看结果——用户在这个留存率/重复粘性上取得多少进展,以及他们花了多少时间来做出反应。
API Calls:
经过适当的配置后,我们便可以获取下一步见解。
B.研究和行动
在下面的截图里,我们可以看到多少比例的用户不仅点击重复粘性邮件,还和他们的社交好友共同分享。在前面的例子里,所有经过配置的步骤都能被用来拖动形成新的目标视图,还可以看到与这个流程相结合的见解。另一个见解在这里非常有用,通过它可以看到多少用户最后通过并在目标机制里收集他们的最后奖励。
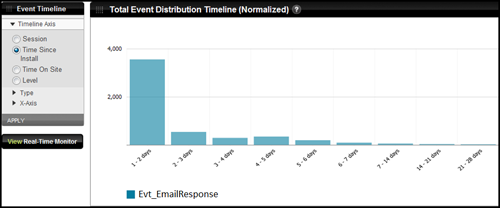
这个系统的一个重要视图是可以看到用户什么时候开始发生某个事件。在上面的流程案例里,能看到用户什么时候回应(点击)那些重复粘性邮件(Step1)。在下面图形里,你能看到表现出来的浏览时间表,也就是x-axis开始安装的时间。
在这里,绝大多数用户在1-2天里对’evt_EmailResponse’进行回应,你可以用A/B法来测试一定的邮件信息,也能在邮件和线规里测试一定的诱因,来看哪一个变量带来最多和最快的回应。你便可以通过目标重置流程和决定来跟踪邮件变量,那些点击包含奖励的特定邮件的用户很有可能完成全部目标(相对于另外一个不同的信息和奖励而言)。
你也可以通过测量“粘性”(DAU/MAU)来跟踪用户对游戏的热情。保持记录这个趋势比单纯的关注DAU/MAU数值更有价值。
最后,你可在每天、每周或每个月里对你的留存率曲线进行最多4个断代分析的浏览。如果优化重复粘性的工作奏效了,每个连续谱线会越来越平缓,因为新的用户通过体验喜欢上了你的游戏,他们会自己决定(或通过回复邮箱里的邮件)回到游戏中来。
在我们检查《Cityville》的目标机制时,有个现象很明显——很多目标合同制展示了多种类型机制的特点。在最后一部分中,我们将会讨论病毒式粘性机制,它可能是一个纯粹的粘性机制与病毒式传播手段的合体,或者粘性机制与交易目标的结合,或者两者皆有。我们也将把用户流和收益能见度联系在一起,讨论一些我们之前未涉及的观点。
Part 5:病毒粘性目标机制
最后一个机制是病毒性吸引机制,就用户行为而言,这可能是最有趣的一个机制。在现实的城市中,建造城市大厅是个重要的时刻。城市大厅让城镇进入了新的时代,巩固其在所建设地区的地位。因而在《Cityville》中,这个地标性建筑也是玩家确立自己地位的奠基石。这也给我们带来了最后也是最有趣的游戏机制:员工安置。
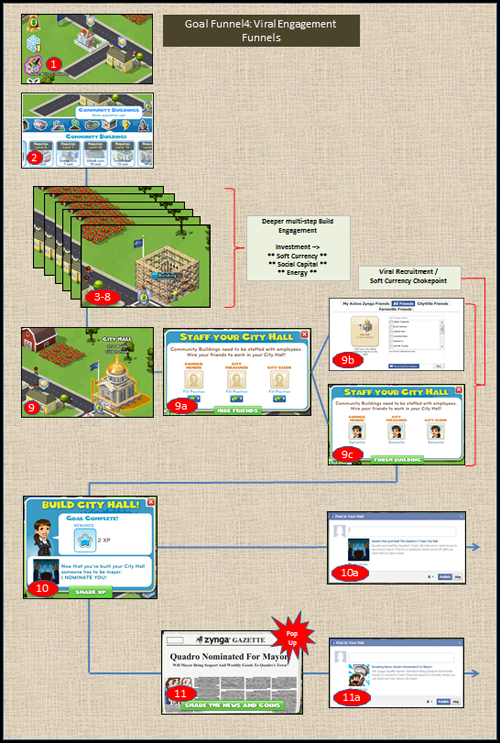
以下是我所采取的发展步骤:树立建造城市大厅的目标;为建筑选址;用3到8步完成建筑建造工作;为城市大厅招募三个员工。
注意:我起先邀请了三个我认为可能快速回应我的招募邀请的人。当我发现并没有在短期内得到回应,我花费了宝贵的City Bucks(游戏邦注:与金币相比,City Buck在游戏中的获得难度更大)。通过City Bucks,我将Samantha(游戏邦注:《CityVille》游戏中的NPC)当做虚拟邻居招募为自己的员工。这样我就可以避开将真实邻居招募为市政厅员工的要求,但在向真实的朋友发送邀请之前不能这么做。
从此用例中可以看到:该机制让玩家在建造建筑物中投入更多时间,而且更多的闲置能量和金币也能增加他们已经投入的社会资金。由于玩家从最终完成的产品中获得更多的成就感,他们将招募机制视为不可逾越障碍的可能性就会更小。
招募机制将另一个重要的社交元素融入游戏之中。为了给市政厅招募员工并在游戏中继续进行下去,玩家就必须有自己的邻居(游戏邦注:无论这个邻居是真实的还是虚拟的)。这个机制强迫那些之前孤身一人的玩家从以下两件事情中选择一个:在他们的社交圈子中添加或邀请现有的或者新的朋友;花钱并支付宝贵的City Bucks将Samantha招募为自己的员工以使游戏进行下去。
招募机制甚为有效,因为它有可能引发下列成果:
病毒式传播循环:从现有用户到新用户(K因子)
如果玩家选择从《Frontierville》或《Farmville》中邀请朋友,这种行为可以加速用户在Zynga游戏间的流动速度。这帮助Zynga之类的系列游戏工作室保住那些热衷于此的付费用户。如果玩家选择向新朋友发送邀请,这个群体也就成了数量庞大的销售单位(游戏邦注:即K因子),帮助Zynga庞大的用户基础扩充更多的玩家。
投入循环:从现有用户到现有用户
如果玩家选择邀请《CityVille》中现有的朋友,他们也变成游戏的销售单位或游戏大使。他们的行为可能引发游戏中其他行为迅速增多,也就会产生更多投入或病毒性传播行为。
玩家在此障碍点处所采取的所有行动对任何社交游戏的两项主要目标有益,那就是用户增长和盈利。玩家通常会首先尝试为市政厅招募真实的邻居,因为即便稍有理智的人都想要留着他们的City Bucks。他们的邀请没有得到朋友的回应后,可能会尝试邀请没有玩这款游戏的玩家。最后,如果上述措施都失败了,他们只能选择耗费City Bucks。这会减少他们宝贵的货币量,增加他们在游戏后期遇到类似困境时花钱购买虚拟货币的可能性。
用户流
1、API calls
在之前的文章中,我已经列举出游戏开发商通过路径分析获取用户流动所需采取的方式,也重温过如何查看和衡量游戏病毒性。在此我想要强调的不再是路径分析和病毒性,而是对事件时机和可盈利性的关注。
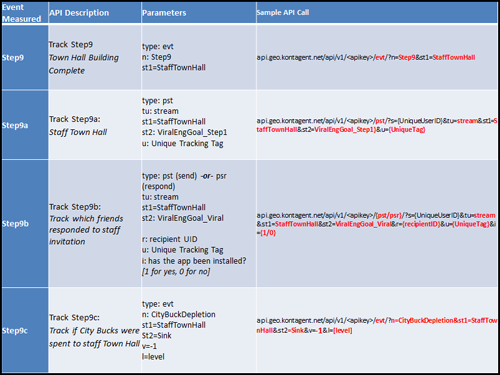
在以下的表格中,追踪对招募邀请进行回应的朋友回应率至关重要,尤其是在实现这个目标前通过用户行为进行A/B测试或其他研究。Step 9c描述了一种新型测量方法,我们可以追踪玩家决定花费City Bucks完成目标时货币的减少数量。应该注意的是我们正在做的两件事情:追踪减少的虚拟货币价值(游戏邦注:以负整数表示);追踪用户使用虚拟货币的关卡。
2、研究和行动
上述测量方法可以让你获得想要的研究结果,而现在要讨论的才是真正有趣的事物。一旦你测量每个事件后,你可以追踪它们发生的时间及其与其他事件的整体比例。以下截图提供了某些研究和以下问题的答案:在每个关卡中,病毒性(Step 9b)和盈利事件(Step 9c)的比例?销售结果是否认同了游戏设计?
很显然可以看出,随着用户逐渐深入游戏,尽管他们有可能变得更为热情,更可能成为游戏病毒性传播者,他们也很可能在城市中与邻居协作、建设、维持和收获并对他们独特的地貌感到惊奇和仰慕,以此来继续他们已经在游戏中有所投入的社交城市的建设。
因而,随着玩家深入游戏,病毒性机制在总体游戏销售机制中占的比例应该越来越少,因为用户更可能花费虚拟货币或真实货币。作为游戏的关键,这种投入或对货币的使用是玩家必须适应的过程。如果这些不成为游戏的中心部分,付费用户和每用户平均收入的比例将会很低。
另一个你可以追踪的有趣研究层面是玩家花多长时间发送邀请来为市政厅招募员工,还有他们的朋友花多长时间对此做出回应。将这两项数据和使用虚拟货币的招募事件的比例结合起来,你就可以得到以下完整的图形。下面的截图表达出多项内容:
(1) 大部分玩家都能玩到建造市政厅这个阶段,在安装和玩游戏的前数个小时向他们的朋友发出邀请。
(2) 那些收到招募邀请的朋友通常在24小时内做出回应。过了这个时间后,回应的用户比例开始逐渐减小,招募邀请也是如此。
(3) 随着玩家逐渐深入游戏,更多人选择使用货币来为他们的市政厅招募员工。这反映出以下事实,要么他们无法找到愿意为他们服务的朋友,要么没有足够的耐心等待事情按部就班地进展。
(4) 从总体上来说,如果玩家需要等待12个小时以上,他们就更倾向于使用City Bucks来为市政厅招募员工。
获得此游戏机制中玩家的做法和行动时间后,你可以得出使用朋友或支付City Bucks招募员工的玩家比例。你可以看到这个比例如何起伏变化,显示出游戏中进行的目标用户获取或测试的不同营销行为的成果。依据你所要优化的项目,你可以根据人们通过这个复杂游戏机制的方法和行为增加或减少这个比例。
之前,我曾提到过游戏内货币的使用情况。在审查是否因货币过多造成虚拟经济通货膨胀方面,查看各个关卡中平衡性的表现至关重要。如果你发现玩家用货币所换来的物品和服务少于预期值,可能就存在轻微的通货膨胀现象。你可以在以下截图中看到你应该维持的经济停滞层面,你可以追踪和监管行为发生的过程。
经过上述分析,你已经看到了可用于潜藏在虚拟生态系统中虚拟经济的虚拟用例,所有的研究方法都可以从中得出并实施。最后我要说明的是,我不知道上述情况是否真是《CityVille》的用户行为情况。我既未见过Mark Pincus,也未曾像John Romero讲述游戏设计那样在设计师中公开发表看法。游戏设计需要靠直觉,但分析可以简单地指引出更好的直觉。这不是让人萌生创意的灵丹妙药,所以你应该凭自己的想法充分享受游戏设计。希望能看到你获得1亿的月活跃用户。(本文为游戏邦/gamerboom.com编译,转载请注明来源:游戏邦)
CityVille’s Goal Funnels Part 1 of 5: Game Mechanics Overview
by Aaron H.
Zynga’s latest release Cityville is the first social game to hit 100 million MAUs. The speed at which the game reached this milestone is truly breathtaking and further cements the social games industry as a paradigm shift in game play; one in which console and more serious gamers and developers are starting to respect.
From Farmville to Frontierville to Cityville, new mechanics have evolved from Zynga’s succession of hit games. They point to an evolving deeper strategic social gameplay for the user. Now, with ever more competition amongst the social game companies for users, engagement and retention are crucial to that DAU/MAU ‘stickiness’ factor.
Kevin Rose, formerly of Digg, did a great blog post on Cityville. We’re going to re-purpose this analysis and look at how discrete goal funnels would be instrumented and analyzed in our dashboard.
Funnels:
All social games funnel users towards goals. Without goals, there is no incentive to play games. Whether the goals are earned rewards, progression upgrades or adding some value to a community, all social games have goals that developers should measure, test and optimize for. For the purposes of this article, I played Cityville until I reached Level 4, just long enough to build a Town Hall, and found four types of goal funnels.
The Viral Funnel: A series of steps designed for the user to spread the game through invites and gifting mechanics.
The Engagement Funnel: A series of steps designed to nurture a user’s progression through game play to deepen a user’s commitment to the game.
The Retention Funnel: A series of steps designed to get the user to return to the game once they’ve ended a session, including emails and notifications.
The Viral Engagement Funnel: Here, a user not only attempts to complete a goal, but also must elicit help from their friends (neighbors) or pay precious virtual credits to complete the goal.
I didn’t include monetization funnels because they can be thought of as a potential revenue event at the end of both engagement and viral/engagement funnels, though a user need never pay a dime for free-to-play games (Zynga would most certainly like you to pay!) We’ll certainly dive into revenue visibility in this series.
In the table below, I’ve broken down each progressive goal funnel in the game up until I reached Level 4. Game mechanics are broken down by Engagement, and Social/Viral mechanics buckets that are persistent throughout the game.
If you’re interested, a full breakdown of my progression with screenshots can be downloaded HERE.
Observations:
There are more viral goal funnels in the first few levels. Zynga knows that the first 15 minutes of game play are crucial to getting players engaged. Even if they drop-off and never play again, they hope that their first-time players send out viral invites and messages to other potential players.
There are easier engagement goal funnels in the first few levels. Zynga also knows that players need to feel a sense of progress and easy flow in order to feel engaged. The first few engagement goals are essentially tutorials, but are designed to award goal completion with social mechanics like naming your city, which then solidifies psychological ownership and social investment over your virtual city.
Viral Engagement Funnels are presented more and more as the game progresses. One inflection point of the game, where players build their City Hall, represents the capstone of the transformation of a player’s city from a small town to something bigger. At this point, players must either recruit neighbors/friends to staff City Hall, or pay gu to staff Samantha, the in-game virtual neighbor in all the roles.
This Viral/Engagement Funnel is the most innovative of CityVille’s goal funnels, and represents a smart evolution in their game play. More often than not, presenting a user with both the option to be viral and the option to monetize will result in the player doing both. He/she will send out invites and then monetize to progress because they do not want to wait for their friend’s responses.
Insights:
All of these funnels can be instrumented using Kontagent’s custom event funnels, and analyzed with our subsequent funnel analysis view. Once events have been instrumented, goal funnels can be dynamically created and analyzed on the fly, with results in a matter of seconds.
Stay tuned for Part 2 of this series, where we walk through each goal funnel type and show what kinds of insights an Indie developer with similar game mechanics and user incentives can gain with our dashboard.(source:kontagent)
CityVille’s Goal Funnels Part 2 of 5: Engagement Goal Funnels
Perfect use case: The Tutorial. Most social games have one. It keeps users on track to a finite defined goal, and usually rewards them at the end. This is a great way to engage your initial users. With the first goal of CityVille to build a new house, we can break down the steps to this funnel and see how a developer would gain insights and optimize this particular engagement funnel to drive more users towards goal completion and deeper into the game.
Using the engagement funnel mapped above, we can dive into a two-step process to describe what insights and actions developers can gain using our platform. We’ll show both a sample API call to show the simple structure of our API calls and the kinds of parameters that can be passed into our servers. We can then dive into the kinds of visibility that can be gained through these API calls, and ultimately prescribe possible actions that can be taken from these deep insights from our social analytics.
User Flows
A. Instrumentation
The table below presents how a CityVille developer would instrument Kontagent’s API calls to gain visibility into user flows.
API Calls:
The API calls are relatively simple: send us what step a user finished. Here, the variable n=event name. The parameter ‘st’ stands for sub-type. You can use up to three sub-types (denoted st1, st2 and st3) to tag an event name with a certain property. In this case, tagging your event name with ‘tutorial’ allows you to search for the tutorial steps later in your list of events. For more detailed documentation on our instrumentation, click here.
B. Insights and Actions
Once instrumented, the events show up in our custom event dashboard. Here, they can be configured to see drop-offs in user flows.
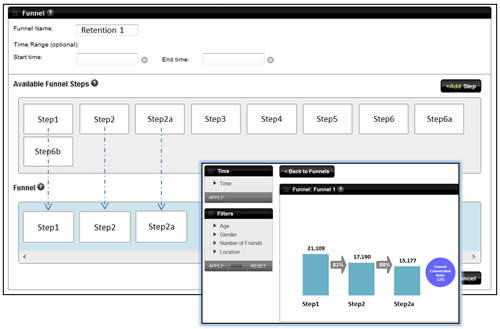
Using the drag-and-drop feature, a funnel can be configured out of any possible combination of custom events.
The resulting funnel provides a great snapshot of the user flow, and can be filtered and constrained on discrete time windows, age, gender, ‘number of friends’, and location. For example, if you wanted to further break your funnel down by just users who were Male, age 18-25 and located in the U.S. and Canada who completed this initial tutorial, you could use the filters to gain that level of visibility.
The engagement funnel flow reveals that the greatest % of user drop-off is between Step 1 and Step 2. This is typical of goal funnels in social games, where users who progress through a funnel become more and more committed to completing a goal as they complete more steps, thereby increasing the % of users who complete subsequent steps. Therefore, optimizing for drop-offs between the first two steps is key. The higher in the funnel you can optimize, the greater an impact it will have on the ultimate goal conversion rate. Here, you can do a user split in your system and test the following ideas:
1) Reducing/Increasing the number of steps to completion
2) Optimizing drop-off from Step1 to Step2 through A/B message testing
3) Testing the placement of the tutorial windows in the iframe of your application. (ie. closer to an actual button you want the user to press, or farther away from the ‘exit’ button, etc.)
Click here for a quick video overview on funnel analysis.
Custom Goals and Engagement
A. Instrumentation
For the purposes of the use case outlined below, we want to track both the custom goal count of tutorial completion and user session lengths.
You can use up to four custom goals in our system (gc1-gc4). Here, we’re setting the custom goal parameter gc1 equal to tutorial completion, where the count is 1 (tutorial completed). Therefore, each goal completion will be denoted in our system as an incremental count. The engagement API message has a timestamp parameter affixed to it so we can define sessions in our system.
B. Insights and Actions
Hourly Visibility: Custom goals allow you to gain insight into important checkpoints of your application. In addition to the usual age, gender, ‘number of friend’ and location filters, you can exploit the hourly data to see what times of the day users are most likely to complete this custom goal of tutorial completion. In addition to total installs, a lot of media buyers already look at custom goal counts to better inform them of their ad buys. One of the most common insights media buyers want to gain visibility into is the number of users who complete a tutorial post-install. Assuming your volume is even (we’re working on making hourly data / uniques available) and you haven’t made any changes on the marketing side, this sort of visibility can help with day-parting for your media buys. Since users who complete a tutorial are more highly engaged, it leads to greater retention and increased monetization.
Used in tandem with the Traffic tab, media buyers can gain powerful insights into the custom goal counts by campaign and ad variant to optimize their bids or provide more effective CPIs for ad partners. In addition to Day 1 and Day 7 retention and K factor available in our traffic tab, custom goal counts like tutorial completion can be leveraged at key engagement checkpoints to better justify bids.
Engagement statistics like average session length and sessions per user are crucial in benchmarking how avid your player base is. They are also one of Kontagent’s 7 deadly social metrics of 2011. Instrumenting the ‘pgr’ API call reveals important insight into average user session lengths, among others. As users become more deeply engaged, average session length increases, confirming that game mechanic tuning is improving the user experience. Keep close tabs on average session length. The right game mechanic optimization through engagement funnel testing can really move the needle. Tutorials like the above CityVille engagement funnel are key in familiarizing incoming players with all the features and game mechanics of a social game, creating a more enriching environment in which players feel more invested in the overall experience.(source:kontagent)
CityVille’s Goal Funnels Part 3 of 5: Viral Goal Funnels
The flow below is a good example of a series of viral funnels that can be tested at different points and measured. The goal of the user flow is (one of the first goals a user must complete in CityVille after the first tutorial) is to build a townhouse to complete a neighborhood. Building a townhouse familiarizes the user with the ‘build’ feature, which depletes energy and in-game coins currency. A user must click a number of times to build a structure, with larger structures taking more clicks, as well as more energy and coins. Here is the specific set of actions I took:
1. Upon placing the townhouse location, I was upgraded to Level 2 with the option to brag to my friends. (Viral Funnel1) [Diagram: 2 - 2a]2. If I clicked the close button on the viral window, another pop-up presented me with the option to email my friends. (Viral Funnel2) [Diagram: 3 - 3a]3. If I clicked the close button and finished building my townhouse, I was also presented with an option to brag to my friends (Viral Funnel3) [Diagram: 6 - 6a]
So, within the task of completing my first real goal after the tutorial I was presented with three opportunities to be viral and spread the adoption of this game.
Using the flow above, we’ll showcase a few more features of our social analytics dashboard. Because CityVille was developed for Facebook, we’ll be diving into the various viral channels as they relate to this platform.
User Flows
A. Instrumentation
The events listed in the table below show how one would instrument each step in order to gain the right insights into user flow. Here, the evt event type is used just as it was in the last blog post where we walked through the engagement funnel. St1 which represents the sub-type, or particular property of the event, is set to “BuildHouse1″. This event property parameter is passed into our servers and can be viewed in our dashboard.
API Calls:
Now, we can dive into why the drag and drop functionality is so crucial in viewing the viral funnels.
B. Insights and Actions
One of the most powerful tools at the disposal of game studios is the ability to create custom funnels. Assuming you’ve instrumented all the custom events above, you
’ll see each event available in the list of funnel steps. Now, all you need to do is drag and drop your steps into the funnel interface to view your drop-off percentages. Because we instrumented custom events, we can use the funnel analysis tab to look at all three viral funnels and see drop-offs.
Simply drag-and-drop to create a new funnel for each Viral Funnel.
…and compare drop-offs amongst the three Viral funnels. Perhaps it makes more sense to test 2 viral funnels instead of 3 within the user flow? You can do a user split in your own servers and see the results in our dashboard.
You can even view the results of the engagement funnel by dragging steps 1, 4 and 5 down to see the drop-off and ultimate conversion rate of users who completed the primary engagement goal. Here, you can also test and see whether adding or removing a viral funnel or an additional step during this engagement funnel goal increases or decreases the % of users who complete the goal of building their neighborhood.
Viral Channels: Viral Co-efficient and A/B Message Testing
A. Instrumentation
There are three opportunities to send a viral channel in the user flow above. The events below are API calls to ensure visibility into the particular viral channels, namely posts and emails. You can see there are a few more parameters than our previous examination of just engagement user flows. Kontagent’s social analytics does not use cookies. Therefore, when instrumenting calls and gauging response rates from viral invites, we always use unique tracking parameters (u parameter) inside the API calls to match send/respond messages. (see the pst / psr event type messages in the table below) Additionally, we use unique recipient IDs (r and i parameters) to ensure that players who respond to viral messages are not current players. A brief definition of a viral loop vs. an engagement loop can be described as the following:
Viral Loop – Initiating an invite or message to a user who does not have the game currently installed.
Re-engagement / Retention Loop – Initiating an invite or message to a user who already has the game installed.
For more information on viral and engagement loops, see our presentation on the A.R.M funnel, a pictorial walk-through on user acquisition, retention and monetization in social games.
You’ll also notice we’ve leveraged the st (subtype) parameters here to tag our events with properties we’ll want to filter off of later. In particular, Step2a shows viral A/B testing within the user flow of the first viral funnel shown in the diagram above.[Diagram: 2 - 2a]
In order to gain visibility into response rates on each message on this A/B test, we’re leveraging st2 and tagging the appropriate message as M1 or M2.
API Calls:
B. Insights and Actions
Let’s take a look at how this instrumentation translates into dashboard insights. The resulting viral event API calls show up in the Virality Tab. Here, you can see the all important K-factor. There have been lots of folks who have written about the fact that virality is dead. But with Facebook, the pendulum tends to swing back.
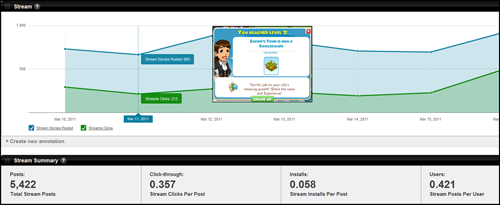
We’ve definitely seen attempts by Facebook to resurrect viral channels as K-factor has steadily increased from a low point around September/October of 2010; maybe a tacit acknowledgment that they might have been too heavy handed in clamping down on viral channels. Here’s a graph of a resurgence in virality from independent Facebook ad buyer Adparlor around Q4 of last year, and we’ve definitely noticed the same increase in monitoring our benchmarks.
True Virality: The concept of True Virality is unique to Kontagent. A lot of research was spent in formulating the right actionable views of viral channels for game developers. The diagram below encapsulates the True Virality concept and shows why it is a better view with which to gain actionable insights. Why look at virality in 1, 3 and 7 day increments? Without this normalized view, which we call True Virality, the K-Factor will always be downward sloping, with the most recent users having less time to infect other users than the older users.
In order to look at viral trends on a normalized basis, it is crucial that developers have a time slice with which to view their trending K-factors. Each dot on the 1, 3 or 7 day graph represents a particular cohort of users who installed the application on that day. For example, with 1-day True Virality, the viral coefficient is presented as the 24-hour post-install infection rate of users on that date.? True Virality essentially eliminates the temporal effects of virality.
Even as viral channels have become less effective in the last year, they can still make the difference between a successful user acquisition strategy and a losing proposition. Using the screenshot below, developers can look at 1, 3 and 7-day True Virality. 7-day True Virality is usually a better view when analyzing invites sent.
It typically takes longer for other uses to respond to invite messages than to posts or notifications.
Additionally, the viral dashboard will show the average number of invites sent per user (or how viral your users are) along with the ‘acceptance’ rate, which is your conversion rate for invites sent. You can also see trending total viral sent and response messages.
Finally, having instrumented our M1 and M2 A/B viral message testing, you can see the results flow into our viral dashboard in the table below.? The A/B test summary table shows you the viral invites sent, accepted (or clicked) and the acceptance rate.
As you can see, there are myriad ways to instrument and gain the crucial insights game developers need. The social analytics platform is flexible enough to handle multiple use cases, depending on what unique game mechanics developers want visibility into. We’ll examine one of CityVille’s Retention Funnels in Part4. Stay tuned!(source:kontagent)
CityVille’s Goal Funnels Part 4 of 5: Retention Goal Funnels
Retention/Re-engagement funnels can be an effective way to re-engage with your current players. Retention funnels are characterized by the following:
1) Emails or ads sent from existing to current users to re-engage with your game or application; and
2) Incentives and rewards once a user re-engages to increase progress further in the game.
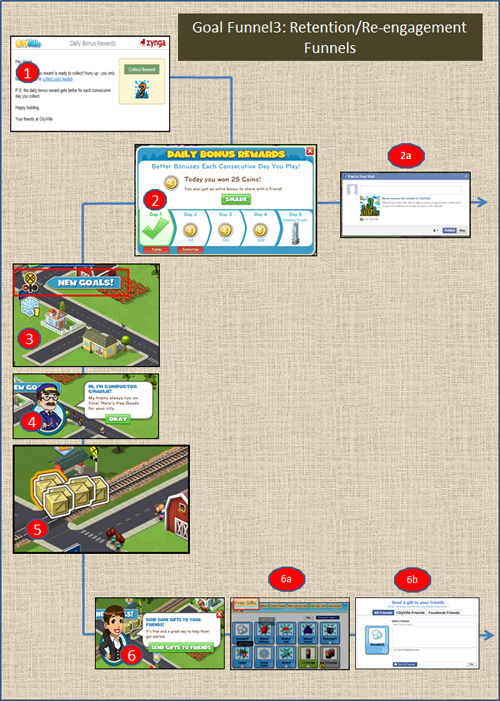
The retention funnel below flows like a typical engagement funnel, but the game mechanics and initial steps are different. The initial step is an email that incentivizes the user to come back to collect a daily bonus reward [Step1]. These appointment dynamics have been cited as a key game mechanic in successful game play.
A successively better reward is offered for each consecutive day a user returns to play. In fact, once a user responds to the email, this first incentive pops up to remind the user of the rewards should they continue to play for the next five days. [Step2-2a]
Because user retention drops most significantly after Day 1, re-engagement campaigns are most crucial the first day after a user installs and plays your game. Not only do rewards incentivize users to return, but once they’re back in the game and spending their awarded currency, more sophisticated game mechanics allow players to build social capital and immerse themselves as they progress deeper into the game.
The funnel below also has two viral opportunities; once on the outset of responding to an email and receiving an award, and once at the end of the funnel [Step6-6b] for completing an easy two-step funnel that was created to award more virtual capital.
Let’s examine the visibility into this user flow.
User Flows
A. Instrumentation
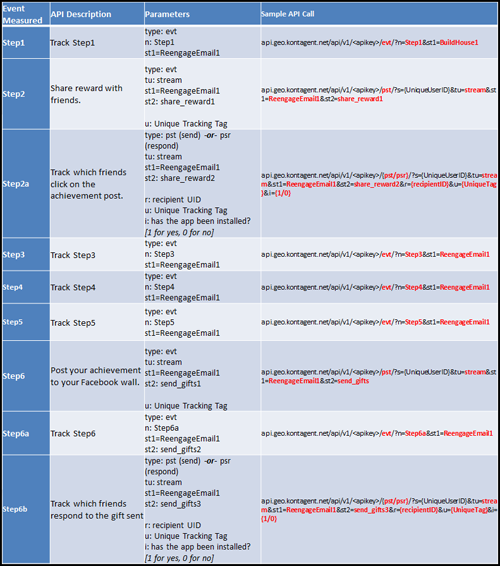
As in previous posts, we track evt messages as part of an engagement funnel. Where appropriate, we are also tracking the viral steps accordingly. For a complete walk through of viral funnels, see our previous post. For all intents and purposes, the goal of this user flow is the same: getting users to complete a certain goal and progress and deepen their social engagement. Viral funnels and rewards are more frequent here, happening twice within this particular funnel. Additionally, the goal of this funnel is simply to collect more virtual goods that can then be used in the game.
One particular point of note here in instrumentation, is the use of the st2 event attribute parameters. In steps 2-2a as well as steps 6-6b, st2 is set as a counter to see how deeply a user gets to the goal of sending a viral message. We then use St1 just like we have in previous posts, to ensure we can aggregate by that attribute and see results, both for how far users progressed within this retention/re-engagement path, and how long it actually took them to respond. For more information on our documentation, including the types and categories of REST Api calls we use, click here.
API Calls:
After proper instrumentation, we can dive into the insights below.
B. Insights and Actions
In the snapshot below, we can again drag and drop to see what percent of users not only clicked on the first step in the re-engagement email, but also went on to share the reward with their social graph. As in the previous examples, all steps that have been instrumented can also be drag and dropped to form new funnel views with which to see any number of insights related to this flow. Another insight that is useful here is to see how many users ultimately go through and collect their final reward from the goal funnel.
One of the key insights that our system enables is the ability to see when users trigger certain events. In the case of the funnel above, it’s important to see when most users respond (click) on the re-engagement email (Step1). In the graph below, you can see the timeline view presented, where the x-axis is the time since install.
Here, most users respond to the event “evt_EmailResponse” within 1-2 days.
Alternatively, you can A/B test certain email messages as well as certain incentives inside the email and gauge which variant got the most responses or the fastest responses. You can then track all the email variants through the retention goal funnel and determine if users who clicked on a certain email with an award were more likely to complete the entire goal than another incentivized email with a different message and award. Click here to watch a quick video on our event timeline views.
You can also track how avid your users are by measuring the ‘stickiness’ (DAU/MAU) with which you can get users to return to play. Keeping a note of this trend is much more powerful in terms of longer-term success than absolute DAU or MAU numbers.
Finally, you can view your retention curve by up to 4 cohorts on a daily, weekly or monthly time basis. If efforts to optimize the retention funnels are working, each successive line should get less and less kinked as new users experience and like your game and decide to return either on their own volition, or through the re-engagement emails sent to their inbox.
As we examine Cityville’s goal funnels, it is apparent that a lot of the goal funnels exhibit characteristics of multiple types of funnels. In the last post, we’ll examine the viral engagement funnel, a blend of a pure engagement funnel with an end goal of either viral recruitment, monetization or both. We’ll also tie the user flow into revenue visibility, something we haven’t touched on up to this point.(source:kontagent)
CityVille’s Goal Funnels Part 5 of 5: Viral Engagement Goal Funnels
The last funnel is a viral engagement funnel, and probably the most interesting one in terms of visibility into the behavior of users. Building a City Hall is a landmark moment in the real life of a city. It represents a coming of age for a town, cementing its place on the land which it was built up from. So too in Cityville, this landmark goal represents a virtual cornerstone for players to establish their mark on their creation. It also introduces our last and most interesting game mechanic: Staffing.
The use case below is outlined with the following steps I took: Initiated building a City Hall goal; Placed the foundation of the structure; Took steps 3-8 to build the structure; Completed building and staffed the structure with three staff.
Note: I first invited three people whom I thought could respond relatively quickly to my invitations for staffing. When I didn’t hear back from them soon enough I spent precious City Bucks which, in contrast to the coins, are much harder to come by in the game. By using City Bucks I used Samantha my virtual neighbor as my staff and was able to circumvent the requirement of staffing Town Hall with real neighbors, but not before I had sent out invitations to real people…
Some observations about this use case: Getting players to click more times to build a structure and thereby depleting more energy and coins also increases the amount of social capital they’ve invested. Since players feel more invested in the final completed product, they are more likely to not view the staffing mechanic as an insurmountable chokepoint.
The staffing mechanic bakes another important social element into the game. It requires players to have neighbors in order to staff buildings and continue in the game (whether real or the virtual Samantha), and it forces players that were previously lone wolves to do one of two things: Add or invite current or new friends from their social graph; or pony up and pays precious City Bucks to staff their building with Samantha to proceed.
The staffing mechanic is quite ingenuous because it has the potential to trigger one or both of the following:
The Viral Loop: New User-to-Existing User (K-Factor)
If players choose to invite friends from Frontierville or Farmville, they expedite the waterfall of users from Zynga game to Zynga game. This helps franchise game studios like Zynga preserve their moat of avid and monetizable users. If players choose to send an invite to a new friend, they’ve also become a quantifiable marketing unit (K factor) and help to draw in more players into Zynga’s massive user base.
The Engagement Loop: Existing User-to-Existing User
If players choose to invite current friends from Cityville, they effectively become quantifiable marketing units or ambassadors for the game. Their action creates a potential multiplier effect of other actions within the game that could spawn even more engagement or viral events.
Any sequence of actions players undertake at this choke point benefits the two main goals of any social game: growth and monetization. Players may try to staff the Town Hall with real neighbors first because as rational individuals they want to preserve their City Bucks. After failing to hear back from a few friends whom they’ve requested as staffers, they may try to invite different friends who may or may not be current players of the game. Finally, if all else fails and they haven’t found that last friend, they will spend City Bucks, thereby depleting their stock of rare currency and increasing the likelihood they will purchase credits with hard currency at a later point in the game given a similar predicament.
User Flows
A. Instrumentation
In the previous posts I’ve outlined what a game developer would do to gain insights into user flows through path analysis. I also went over how to see and measure virality in our dashboard. The insights I want to highlight in this post are going to focus not on path analysis and virality, but on event timing and revenue visibility.
In the table below, tracking response rates on friends who respond to staffing invites is crucial, especially if there is message A/B testing or other insights being derived from a user’s behavior prior to this goal. A new instrumentation method is described in Step 9c, where we track the amount of currency being depleted if players decide to spend City Bucks to complete the goal. Note the fact that we’re doing two things: Tracking the value of virtual currency being depleted (here a negative integer); and Tracking the level this depletion is happening on.
API Calls:
B. Insights and Actions
Instrumenting custom events will get you closest to the granular insights you’re looking for. Here’s where things get really interesting. Once you’ve instrumented each event, you can track when they are triggered, and in what overall proportion to other events. The snapshot below provides some insights and answers the following question: What proportion of viral (Step 9b) to revenue/engagement events (Step 9c) happen at each level? Does the distribution confirm the intent of the game design?
Evidently, as users progress through a game, though they have the opportunity to become more avid and are more likely to be viral evangelists, they are also more likely to continue building on the social capital they’ve invested in the game through collaborating with neighbors, building, maintaining and harvesting in their towns, and marveling and admiring their unique landscape.
Therefore, as players progress through levels, viral mechanics should make up a lower proportion of the overall distribution of game mechanics as users are presented with more opportunities to expend either soft or hard currency. This ‘sink’ or depletion of currency is what players must become used to as a key driver of progress.
If it is not a central part of game play, the % of paying users and ARPU (average revenue per user) will be much lower.
Another interesting level of insight you can track is the proportional distribution of how long it takes players to send out invites to staff their Town Hall, coupled with how long it takes their friends to respond. Throw in the proportion of staffing events using currency and you’ve got the complete picture below. The snapshot below sheds light on a few things:
Most players reach this first checkpoint of building a Town Hall and sending out invitations to their friends within the first few hours of installing and playing the game.
Friends who receive an invite to staff a building generally respond within 24 hours. Afterwards the proportion of users who respond trails off, as do the invitations to staff.
As players progress in the game, more and more of them turn to using currency to staff their Town Hall, in a reflection of either their inability to find friends to staff their buildings with, or general impatience with having to wait to proceed.
In general, if players have to wait more than 12 hours, their propensity to use City Bucks to staff their Town Hall increases.
After gaining visibility into how and when users behave around this game mechanic, you can gauge the ratio of staffing using friends vs. staffing by paying City bucks.
You can see how this ratio fluctuates over time, given the influence of different marketing effects in your user acquisition targeting or testing being done in your game. Depending on what you’re optimizing for, you may want to either increase or decrease this ratio depending on how people behave once they’ve progressed past this sophisticated game mechanic.
Earlier, I referred to the depletion or ‘sink’ of in-game currency expended. Seeing how the balance plays out within each level is crucial in determining whether you’re flooding your virtual economy with too much currency; a virtual QE2 in effect. In times of pain where your players might not be exchanging as many goods and services with each other as you would prefer, it might make sense to create a slightly inflationary environment. You can see in the snapshot below that whatever level of economic stasis you want to maintain, you can track and monitor the progress of your efforts; something the likes of Ben Bernake would kill for.
So there you have it. A virtual use case for a virtual economy inside a virtual ecosystem where all manner of insights can be derived and acted upon. One last caveat:
I don’t know if any of this is true with CityVille user behavior. I’ve never met Mark Pincus, nor do I profess to be in the same realm of designers like John Romero to speak on game design. Intuition in game design and tuning is like any muscle. Analytics simply enforces and hones better intuition. It’s not a panacea for creativity, so get your game design hats on and enjoy the ride. Hopefully we’ll be there with you when you’re eating Cup-o-noodles out of a flooded basement all the way to your 100 millionth MAU. (Source: kontagent)
上一篇:总结社交游戏易用性的8大测试方法
















 闽公网安备35020302001549号