《Replica Island》开发者谈游戏测试系统设置
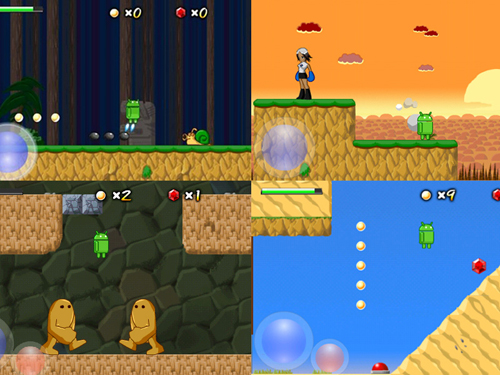
游戏邦注:本文摘自《游戏开发者杂志》(Game Developer magazine)2010年9月期刊,作者是Android游戏开发者Chris Pruett,他在文中详细地描述了自己如何以低成本手段,快速创建针对手机游戏《小绿人历险记》(Replica Island)的有效测试记录系统的方法。
游戏开发者看别人玩自己创造的作品,这种体验和自个儿每天接触这款游戏的感觉明显不同。因为你每天都在玩同一款游戏,就会在无意识中形成一套驾轻就熟的特定玩法,只有把游戏交给新手,你才有可能发现它的动画设置、操作提示、间歇性漏洞等问题都在此时被放大了,自己和他人的游戏体验根本就是两码事。
无论你自己优化了多少回,修补了多少个漏洞,但由于你已经形成了特定的玩法,而且对这款游戏内容了如指掌,所以很容易忽视其他玩家可能遇到的问题。这也正是玩法测试对打造一款优秀游戏极其关键的原因所在。如果想获得更多玩法测试信息,你就得善于从中搜集相关数据,并进行有效分析。下文是我在这种操作上的一些心得。
简单的玩法测试
我初涉这一行时主要编写Game Boy Advance游戏,当时我们的测试很简单,就是把附近的一些孩子叫进来,人手发放一个特制的GBA,这个掌上游戏机系统与VCR相连接,这样孩子们玩一会儿游戏后,我们就能倒带查看他们的游戏过程,可以马上找出那些具有直接影响作用的漏洞。
但我们并没有留意到,这种方法并不能反映这玩家在游戏中受困的原因。只有当一定数量的目标用户都栽倒在特定环节时,大家才会意识到这款游戏有些地方需要修改。就这样,我们靠一帮小孩的多次配合,以及通过VCR的反复观察,极大地完善了游戏设计。
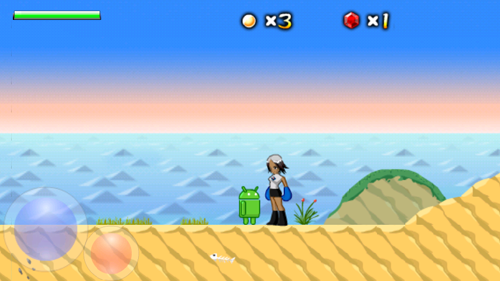
现在我是一名Android手机游戏开发者及支持者,第一款Android作品就是《小绿人历险记》,它也是一款side-scroller风格的游戏,和我十年前制作的GBA游戏并没太大区别。不同的是,我已经不再给游戏工作室打工了,仅靠一个美工的协助,在闲暇时间一个人开发了《小绿人历险记》。
而且我也已经不再找那些孩子测试游戏了,如果非如此不可的话,我也会找一些更年长的目标用户来执行测试。但是问题又来了,要输出玩家在手机上试玩游戏的测试信息,可真不是一桩易事。唯一的办法就是站在他们背后看,但这种举动多少有点唐突,而且也会影响玩家的游戏体验。
面对这种情况,我一个独立手机游戏开发者究竟能怎么办?在快完成《小绿人历险记》的时候,我才意识到自己对它到底好不好玩实在没有把握。这款游戏是在闭门造车的情况下完成的,只有让更多人试试效果,我才有信心向世人推广它。
我尝试的第一套方案就是用户问卷调查。我将游戏投放到了一个内部网站,并向用户发送了一封电子邮件,邀请他们试玩游戏并提供反馈意见。我甚至专门创建了一个反馈论坛,上面有针对这款游戏的一些提问。
但这种方法真是彻头彻尾的失败,虽然有许多人下载了游戏,可是只有极少数(不到1%)人愿意搭理仅有五道题的调查问卷;而这些提交了调查问卷的用户,也并没有提供什么具有参考价值的信息,我无从判断这款游戏是否难度太大,究竟是玩家控制系统、关卡设计、益智设计,还是入门引导中的哪一个环节出现了问题。
向他人取经
遭遇这次挫折之后,我想起了Naughty Dog工作室针对《Crash Bandicoot》原版本开发的玩家反馈系统。这个系统可以将玩家在游戏过程中的相关统计资料保存在记忆卡里,开发者可以在离线状态下对数据进行整理,查看玩家在哪个游戏环节耗时最长,哪个区域的玩家死亡率最高。
依靠这个系统提供的数据,Naughty Dog重新修改了游戏“事故频发”区域的设置,也调整了游戏的动态难度调节系统。Naughty Dog设计这个系统的有趣理念之一就是,无论如何都要防止游戏玩家过早败下阵来。他们的终极目标是清除导致玩家无故被卡,不能动弹的漏洞。
我觉得这是一个很酷的主意,但不确定它在手机平台上是不是同样可行。我问了周围一些人,打听目前的大型游戏是怎么执行测试操作的,发现有许多公司都已经有一些不同的测试方法。但有些人告诉我,虽然他们可以搜集到很多信息,但要从中分析出有助于改进游戏设计的数据却非常困难。
还有一些工作室使用的是可以再现玩家闯关过程的分析工具,甚至可以统计出玩家最喜欢的武器、最难战胜的敌人、可视性最强的地图区位等资料。这种搜集用户试玩信息的系统,适用于多种类型的游戏,但如果要从中获取有价值的信息,这些游戏工作室还得花费大量时间创建数据分析工具。
由此可见,搜集数据并不难,难的是获取有价值的信息。
这种情况听起来很让人沮丧,因为我的目标就是让游戏测试工具越简单越好。但我还是决定先用一些关键的参数,试试这种记录系统究竟是否可行。当时我的Android手机没有记忆卡,但可以稳定连接互联网。所以我想,也许可以先让系统将玩家的重要活动记录下来,发送到一个服务器,然后再由服务器输出玩家的测试信息。我希望能用最简单的系统,获得最多的玩家信息。
推出初级版测试系统
我编写的这个活动记录系统很简单,只有三个内容:一、在游戏运行过程中搜索玩家活动情况,并将其发送到服务器的控制流;二、服务器本身;三、负责分析服务器所记录数据的工具。
在这三者中,“服务器”最为关键。我用PHP脚本编写了一个服务器,大约30行的代码,可以搜集针对HTTP发送的调查内容,将结果编写到MySQL数据库中。调查内容十分简单,仅包括:活动名称、关卡名称、XY坐标定位、版本代码、用户访问名、时间标识。这些数据都会根据字段,逐条记录到数据库;这些数据处理也是通过PHP来完成(但从长远来看,这是个失误的决策),只有在必要的时候,才会加载一个特殊的仪表板页面。
我最先开始测试的是玩家死亡率和闯关级别。每当一名玩家死亡或者闯过一关时,系统都会把这些活动记录到服务器。通过这些数据,我就可以观察出玩家闯哪一关时耗时最长,哪一个环节阵亡的人员最多,哪一个难关居然轻易被攻破。
通过这些数据,我还可以统计出某一关卡上的死亡率,每名玩家的平均死亡次数。
这个系统的空间定位功能,还能帮助我判断玩家的死因,知道他们哪一次是死于敌人之手,哪一回是因陷阱而丧命。事实证明,游戏首次植入这个活动记录系统后的效果出奇理想。
在这个初级版记录系统的帮助下,我又推出了一个游戏升级版本,继续观察相关数据,很快又发现了新问题:有一些关卡无人过关,玩家几乎立即毙命;玩家在另外一些环节中经常被卡长达数小时(表明这个关卡设计很失败,因为按原来的设计,玩家只需要5分钟就能过关)。有了这些数据资料,我就很清楚哪些关卡的修改工作量最大。
但仅仅找出问题关卡是远远不够的,有时候我还是不知道它们的问题出在哪里。
所以我又使用同样的数据,编写了可以监测玩家死亡位置的工具,这样我就可以通过关卡设计层看到玩家死亡率或存活率最高的区域,这个工具的初级版本是以点状分布图来显示死亡人数,后来玩家死亡率大幅上升时,我就改用热地图来显示玩家死亡分布(见下图)。
游戏设计失误
我推出的提高玩家闯关级别、死亡监测热地图的工具,很快就取得了立杆见影的效果。比如说,我可以从中发现大量玩家在某个关卡都死于第一个敌人之手,但并不是因为这个敌人太难对付,而是因为敌人的临空而降实在让他们措手不及,无法防范——玩家所在区位的天花板太低了,他们看不到敌人出现的方向。
另外我还发现,原先那个简单的动态难度调整系统本身就需要改进和调整。经过又一轮死亡潮后,我让这个系统悄悄地提高了玩家的存活率和飞行能力,然后再观察数据发现,我其实早该这么做了。
我还对游戏关卡的几何设计进行了大幅度的改动。我看到有不少关卡死亡率极低,仅仅是因为玩家在地图中迷路了。于是我就对道路进行了重新设置,让它更加清晰明了;有时候甚至彻底抛弃整个关卡,设计一个全新的环节。
最大的问题在于游戏中的陷阱设置。《小绿人历险记》中有许多需要玩家跃过的陷阱,但游戏虚拟人物的主要代步方式并非跳跃,而是飞行。
游戏主人公——绿色Android机器人的脚上有一个火箭飞行器,它原先的移动方式是:在地面上时要先酝酿动力,然后一飞冲天,再借助这种动力以及飞行器的力量四处飞行。但火箭飞行器的能量消耗得很快,所以机器人着陆时要重新补充能量。我决定将它调整为,玩家飞升的时候,可以利用这种能量飞向遥远的平台,或者向敌人发动准确无误的攻击。
这种调整取得了良好的效果,但是我再看玩家测试数据时,又发现许多人扎堆死在无底洞中,甚至还有人会掉进极小的洞穴;死于陷阱的玩家人数仍然是居高不下,玩家的跳跃能力并没有提高。
获得这种信息后,我重新审视了游戏关卡设计,并发现了一些新问题。最根本的原因是,玩家看不到自己必须跃过的陷阱。首先,游戏界面中没有任何关于死亡陷阱的危险提示,而我设置的台阶又总是太高,玩家无法判断哪些坑会让自己跌到更低的级别,哪个坑会将引向万劫不复的深渊。
其次,也是最关键的一点,游戏中的摄像头运行效果并不理想,不能保证地面的可视性,当玩家向空中飞跃时,游戏界面就滚动到了屏幕顶端,导致他们无法看清路面状况,不知从何处着陆。
《Super Mario Bros》这款经典游戏的界面几乎从不采用垂直滚动方式,它有一整套严格复杂的标准,规定在哪些特定情况下,摄像机位可以上下移动。因为《小绿人历险记》中有飞行功能设置,所以我不得不支持界面垂直滚动方式。为了改变这种现象,我又开发了一个更智能的摄像头,只有在玩家快要离开可视范围时,游戏界面才会垂直滚动。
经过这些变更,我又向玩家推出了又一个游戏更新版本,并和上一个版本的测试结果进行了对比。结果非常乐观,玩家死亡率已经大幅下降,闯关所耗时长也在正常范畴之类,因陷阱而阵亡的人数大量减少了。
正式发布游戏
在我的测试团队的帮助下,我对这款游戏进行了一轮又一轮的更新和调整,最后才决定正式向市场投放游戏,但仍然保留了原来的测试系统,因为我想看看系统从在线用户所搜集到的情况,与测试团队所反映的数据究竟有多大差别。
当然,任何一款手机应用向服务器发送数据时,最好都要让用户知情。《小绿人历险记》刚发布时,首先会在游戏界面出现一个欢迎信息,并告知用户:为了完善这款游戏设计,他们在玩游戏过程中形成的匿名数据,将发送到一个服务器以便开发者了解情况,如果他们不想参与调查,可以直接关闭菜单中的系统记录选项。
看来这种方法才是最佳解决方案:它是开源代码,任何人都可以打开数据包查看其中内容(我保证这些数据不会锁定某一个特定的用户或手机ID),而且用户有权退出这项调查。
从Android Market上的游戏安装数量来看,选择退出调查的用户还不到20%,也就是说大部分用户都愿意参与系统追踪调查。
我也因此搜集到了海量的数据,超过了1400万个数据点(游戏邦注:截止本文撰稿,该游戏的用户大约120万人)。
如此庞大的信息量很快就撑破了我的数据处理工具,之后还有许多工具都因此而瘫痪。我只好截取前1万3000名玩家的活动资料进行分析,这些玩家的综合数据与小规模测试团队的信息非常接近,这表明测试团队的调查结果也适用于大规模的用户群体。
测试效果很理想
我对《小绿人历险记》的这个活动记录系统非常满意,因为它的开发非常省心省力,几乎不需要投入什么成本(服务器后端的开销比申请一个Xbox Live帐号还便宜),而且只需要调查两项活动内容,我就能快速有效地找到游戏玩家的事故多发地带。更重要的是,我通过搜集这些数据,还能和不同测试版本的统计结果进行对比,很容易就可以看出设计调整的效果如何。
使用PHP和MySQL作为服务器后端的编写语言也是一个很正确的选择,活动记录只是一些很零碎的程序,任何一种语言都能顺利执行这个操作,但有了PHP,整个服务器不需要30分钟就能完成所有的数据整合。
通过一个独立控制流来记录玩家的游戏活动,也是一个很积极的对策。我不希望有任何一个UI阻挡HTTP的调查请求界面,所以将网络通信内容移到了这个独立控制流。我一开始非常担心成本支出的问题,但事实证明,这种成本支出实在是微乎其微,我甚至懒得将它列到财务报表中。
最后,保持整个记录系统的简洁性也真是一个智举。我之前也有想过很多种备选的活动记录内容,但对《小绿人历险记》来说,追踪玩家死亡和闯关情况就已经足够了。越多统计资料意味着数据处理将更为复杂繁琐,甚至难以提炼出有效的反馈信息。我现在对控制这种自动记录系统已经有经验了,所以将来可能会增加一些调查参数,当然刚起步时还是首选比较简单的记录系统,这一点是不会有错的。
记录系统的局限性
这个活动记录系统并非无所不能,它的设计仍然有一些不足和缺陷。
用PHP来编写服务器是个很不错的选择,但如果拿它来处理数据就完全不可行了。我原先的想法是,通过一个网页仪表板处理数据,但数据流量加大时,PHP就完全无法招架了。另外,PHP对硬件内存和运行速度的要求很高,我常常因为这些局限性而浪费了不少时间。当游戏用户超过2万人时,大部分基于PHP开发的工具全部罢工。
通过PHP编写的Bitmap处理程序尤其要命,我用PHP制作了所有的热地图,实际上我应该编写一些可以在本地运行,而不是仅限于网络服务器的程序。在PHP GD界面中,我发现了很多漏洞,为了处理程序我又不得不缩小关卡设计层的图像。
现在我又用Python和ImageMaick重新编写了这项工具,效果非常理想。我在《游戏开发者杂志》的官方网站上公布了实现这项操作的代码,如果各位有兴趣可以上去看看。
最后要提的是,虽然这个系统所提供的数据可以让我了解玩家死因,闯关时长等信息,但我并不能找到那些不会导致死亡,但会限制玩家游戏体验的活动死角。因为这个系统没办捕捉到这些信息,我的一些关键性关卡设计也出现了不少问题,最严重的例子就是,玩家无故被卡在某个环节中,大家都不知道要怎么脱身,最后只好放弃闯关。
我的系统并不能反映这种现象,我也是自己听到玩家抱怨,才得知了这一情况。所以我要说的就是,这种自动活动记录系统虽然超级好用,但并不能准确反映整个游戏的全貌。从我自己的经历来看,这个系统在查找问题关卡的布局上很管用,但却不能明确指出游戏的具体设计失误。
总结:
至于今后要开发的游戏,我当然还会植入这种自动记录系统来观察用户体验效果。除了死亡区域,我还会增加针对不同死法的监测,这样才能知道玩家是怎么赢掉游戏任务的;另外,从游戏的实际情况出发,我认为增加一项玩家死前的区位历史记录也很有必要,这样可以追踪该玩家的游戏路径。
不过,编写这种系统关键还是要让它尽量简化;另外搜集到充分的数据并非大功告成,只有开发出可处理数据的工具才能算是完成任务。所以我开发下一款游戏时,有可能继续用这种记录系统和数据存储解决方案,但会集中大部分精力编写行之有效的数据分析工具。
如果服务器可以读取个人玩家的活动记录,那这个系统也一定适用于大规模的玩家群体,它可记录的数据类型应该是多种多样,只是我们暂时还没有想到。它并不是一个完美的玩法测试系统,但至少可以长期提供有价值的反馈信息。
通过这个极其简单的系统开发过程,我对游戏的关卡设计、用户的游戏习惯有了更深入的了解,也因此极大优化了游戏。唯一的遗憾就是,我真后悔自己早些时候的游戏没有采用这个系统,因为它适用于任何平台、任何类型的游戏。(本文为游戏邦/gamerboom.com编译,转载请注明来源:游戏邦)
Hot Failure: Tuning Gameplay With Simple Player Metrics
[In this article taken from Game Developer magazine's September 2010 issue, Google game developer advocate Chris Pruett describes how he quickly and cheaply implemented useful metrics into his Android game, Replica Island.]
There’s nothing like watching somebody else play your game. Over the course of development, you’ve played the game daily, and have, perhaps unconsciously, developed a particular play style. But putting your work into the hands of a novice gives you a chance to see what happens to your design when it’s played without the benefit of daily practice.
Every collision pop, animation snap, confusing tutorial message, and intermittent bug seems amplified when a beginner plays. No matter how much you polish or how many bugs you fix, your play style and intimate familiarity with the content can bias you away from problems that other users will immediately encounter.
That is why playtesting is a vital part of making a good game. In order to truly get the most from playtesting, you’re going to have to take some data from these sessions — this article chronicles my experience with gathering gameplay metrics.
Starting Simple
I got my start in the industry writing Game Boy Advance games. Back then, our idea of playtesting was pretty straightforward: we would get some local kids to come in, hand them a special GBA that was hooked up to a VCR, let them play for a bit, and then go back and review the tapes. This procedure yielded immediate, dramatic bugs.
Areas that the team took for granted were often sources of tremendous frustration for our testers. When a member of the target audience fails continuously in a specific area, it is usually a clear message that something needs to be fixed. A couple iterations with real live kids and the side-scrollers we were making would be vastly improved.
Nowadays, I work on and advocate games for Android phones. My first Android game, Replica Island, is a side-scroller, not so different from the GBA games I was making 10 years ago. But some things have changed: I’m no longer working for a game studio; I wrote Replica Island on my own, with the help of a single artist, mostly on my free time.
I also no longer have access to a pool of young playtesters, and even if I did, my target audience is a bit older. Finally, there’s no easy way to record the output of a phone while somebody is playing — the only way to really see what’s going on is to stand over their shoulder, which is awkward and can influence the way the tester plays.
What is an indie phone game developer to do? As I reached feature completeness for Replica Island, I realized that I really had no way to guarantee that it was any fun. The game had been developed in a vacuum, and I needed to get more eyes on it before I could feel confident releasing it.
The first thing I tried was user surveys. I put the game up on an internal page at work and sent out an email asking folks to play it and give me feedback. I even set up a feedback forum with a few questions about the game.
This approach was pretty much a complete failure; though many people downloaded the game, very few (less than 1 percent) bothered to fill out my five question survey. Those who did fill out the survey often didn’t provide enough information; it’s pretty hard to tell if “game is too hard” indicates a failure in the player controls, or the level design, or the puzzle design, or the tutorial levels, or what.
Thinking About Metrics
After that setback, I remembered reading about the player metrics system Naughty Dog developed for the original Crash Bandicoot. The system wrote statistics about play to the memory card, which could then be aggregated offline to find areas that took too long or had a high number of player deaths.
These problematic areas were reworked, and the data was also used to tune the dynamic difficulty adjustment system in that game. One of the most interesting principles that fed into the design of this system was Naughty Dog’s idea that the game over screen must be avoided at all costs. Their end goal was to remove “shelf moments,” moments in which the player got stuck and could not continue.
I thought this was a pretty cool idea, but I wasn’t sure how feasible it would be on a phone. I asked around a bit to see what the current state of metrics recording is on big-budget games, and found that many companies have some way to report statistics about player actions. Several people told me that while they collect a lot of information, they have trouble parsing that data into results that suggest specific design changes.
On the other hand, some studios have tools that can recreate a player’s path through a level, and produce statistics about which weapons users prefer, which enemies are particularly tough, and which parts of the map are particularly visible. It seems that collection of player metrics is applicable to a wide variety of games, but that it only benefits the studios who also take significant time to build tools to crunch all the data that they collect.
(For an example of how this kind of system can be taken to the extreme, see Georg Zoeller’s talk about the crazy system they have at BioWare.) It turns out that collecting the data is the easy part– rendering it in a way that is useful for designers is much harder.
That sounded discouraging, as my goal was to keep my tool chain as simple as possible. But I decided to experiment with some metrics recording anyway, starting with just a few key metrics. My Android phone didn’t have a memory card, but it did have a persistent internet connection. Maybe, I thought, I could log a few important events, send them to a server, and get results from players that way. My goal was to try to understand as much as possible about my players while keeping the system as simple as possible.
The Basic System
The event logging system that I wrote has three parts: a thread in the game runtime that collects player events and sends them to a server; the server itself; and finally a tool to parse the data recorded by the server.
“Server” is a strong word in that second component. My server is actually a PHP script that, in about 30 lines of code, validates the HTTP Get query it is sent and writes the results to a MySQL database. The query itself is dead-simple: it’s just an event name, level name, xy location, version code, session id, and time stamp. These fields are recorded to the database verbatim. The actual processing of the data is also done in PHP (a poor choice, in the long run; more on that later), though only on demand when a special dashboard page is loaded.
I started with just two events: player death and level completion. Each time a player dies or completes a level, the game reports that event to the server. From this data, I was able to construct a pretty detailed overview of the game flow. I could see which levels took the longest, which had the most deaths, and which were unusually short.
By dividing my values by the number of unique players, I could also see what percentage of players died on certain levels, and the average number of deaths for each player.
By looking at the spatial location of the event, I could tell the difference between a death from an enemy and a death from a pit. As a first-pass implementation, my simple metrics system proved to be pretty detailed.
Highlighting Failure in Bright Red
Once I had the basic reporting system up and running, I released an update to my testers and watched the data flow in. Very quickly, patterns emerged; there were some levels where almost 100 percent of players died at least once, and other levels in which players were getting stuck for hours (indicating a pretty major failure for a level designed to take five minutes). Just by looking at the numbers, I had a clear picture of which levels needed the most work.
But identifying problematic levels wasn’t enough. Sometimes I couldn’t tell why a particular level was a problem.
So I went a step further. Using the same data, I wrote a tool to plot the death positions on top of the level art so that I could see exactly where users were dying (and where they were not). The first pass of this system just drew a little dot on the level art when a player died, but once the number of players grew to be large, I switched to rendering heat maps of death locations over the levels, which was much easier to read (see “How to Make Heat Maps,” at the end of this feature).
Game Design Failures as Object Lessons
The combination of high-level play statistics and plotted death locations was illuminating. I learned, for example, that a huge number of players were dying at the very first enemy. This was not because the enemy was particularly hard; after considering the problem, I realized it was because the enemy appeared in a spot where the main attack — a crushing butt stomp, performed from the air– was difficult to accomplish due to a low ceiling.
I also learned that my simple dynamic difficulty adjustment system needed adjusting itself. This system secretly increases the player’s life and flight power after a certain number of consecutive deaths, and by looking at the data, I could see that it needed to kick in a lot earlier.
I also made sweeping changes to my level geometry. I had a few levels with very high completion times but very few deaths, and I realized that players were simply getting lost. I reworked these levels to make the paths through them clearer; in one or two cases, I scrapped an entire level and made a new one from scratch.
But the biggest problem that I identified was with pits. Replica Island is a platformer, and as you can guess, it involves a lot of jumping over pits. But unlike certain spinning marsupials and pipe-dwelling plumbers, my character’s main mode of transport is flight.
I needed a control system that did not require a D-pad, so the protagonist in Replica Island, the green Android robot, flies using rocket thrusters on his feet. The basic movement model involves getting momentum up while on the ground before jumping into the air and using that momentum, along with the thrusters, to fly around. The thrusters run out of juice quickly but refill when you land, so the idea is that a player will jump into the air and then carefully expend his fuel to reach distant ledges or line up a precision butt stomp.
All that is well and good, but when I looked at the death data coming back from my playtesters I found that they were dying in bottomless pits en masse. Droves of players were falling down even the smallest of holes. And of even greater concern, the death-by-pits numbers did not decrease over the course of the game; players were not getting better at making jumps as time went on.
With this information in hand, I reviewed my core game and level design and came up with a number of theories. The basic problem, I decided, was that players could not see the pits they were jumping over. First of all, there was no visual indication that a pit of death is a pit of death; since my levels are often very tall, it’s hard to tell which pits lead to some underground level segment and which lead to a grisly demise.
Second, and most important, my camera was not doing a good enough job of keeping the floor visible when the player jumped into the air. Almost as soon as the player leaps into the air the ground would scroll off the bottom of the screen, making it hard to judge where to land.
Master platformers like Super Mario Bros. almost never scroll vertically; Mario has a whole set of complicated rules dictating which specific circumstances allow the camera to move up and down. In Replica Island, however, the flight mechanic meant that I had to allow vertical scrolling in the general case. After a bunch of tweaking, I came up with a smarter camera that does not begin to scroll vertically unless the player is close to leaving the visible space themselves.
After making these changes, I shipped another update to my beta testers and compared the results to the previous version. The deltas were very reassuring; deaths were down overall, level completion times were, for the most part, back into normal ranges, and pit deaths dropped by a pretty huge margin. I iterated several more times with these testers before I was ready for release, but with the metrics reporting system in place, it was easy to see whether my changes were having an influence on how my testers were playing.
Hello World
After several iterations with my test group, my graphs started to align to the bell curve I was looking for. It was time to ship the game, and I decided to leave the metrics system in place. I wondered if the data I collected from live users would look different from the data produced by my test group. There was only one way to find out.
Of course, any time an app reports data back to a server, it’s best to let the user know about it. The first time Replica Island is launched, a welcome message appears that details the latest game improvements. That message also informs the user that anonymous, non-personal play data will be uploaded to a remote server in order to improve the game, and that players who do not wish to participate may turn the reporting system off in the options menu.
This approach seemed like the best solution: though the code is open source and anybody can look at the content of the data packet itself (and I ensured that nothing about the metrics data can be tied to any specific user or device), allowing users to opt-out gives them an opportunity to say “no thanks.”
By comparing my Android Market installs with the number of unique users reporting in, it looks like less than 20 percent of my users chose to opt out of metrics disclosure.
As a result, I have a huge amount of data now — over 14 million data points, close to a gigabyte of event information generated by my user base (which, as of this writing, is about 1.2 million players).
In fact, the volume of data broke my data processing tools pretty quickly; I have a snapshot of statistics from the first 13,000 players (which I have published on the Replica Island website), but after that, a lot of my tools failed. The good news is the first 13,000 players produced aggregate data that was very similar to the smaller test group, which probably means that the test group results can be applied to much larger groups of players.
Somehow, This Plan Worked Out
I have been extremely satisfied with the event reporting system in Replica Island. For very little work, almost no cost (the server back end that records events costs less than an Xbox Live account), and using only two types of events, I was able to quickly and effectively identify areas where players were having trouble. Furthermore, once I started collecting this data, I was able to compare the aggregate result of my metrics between versions, which made it easier to see if my design changes were effective.
Using PHP and MySQL as my back end server language was a good choice; the actual recording of events is so trivial that I’m sure any language would have worked, but with PHP, the whole server took less than 30 minutes to put together.
Using a separate thread to report events from the game was a good move as well. I didn’t want any sort of UI to block HTTP requests, and moving the web communication to a separate thread made sense, but I initially had some concerns about overhead. I needn’t have worried; the overhead is so small, I can’t even get it to show up in my profiler.
Finally, keeping the system as simple as possible was a really positive decision. I considered a lot of potential event candidates, but for my game, tracking player death and level completion provided more than enough information. More statistics would have complicated the processing of the data, and possibly made it harder to reduce the feedback to a concise view. Now that I’ve had some experience with automatic metrics reporting, I’ll probably increase the volume of data that I send back in the future, but starting simple was definitely a good move.
Bumps Along the Way
Not everything about the event reporting system worked out well, however. I made a few decisions that ultimately turned out poorly, or just wasted time.
The decision to use PHP for the reporting server was a good one. It was a mistake, however, to use PHP to do the processing of the data. My idea had been to do everything via a web dashboard (I even wrote my level editor in PHP and Javascript), but PHP fell down hard when the amount of data I needed to manage exploded. PHP runs in pretty strict memory and speed requirements, and I found myself hacking around these limitations almost immediately. Once I passed 20,000 users, most of my PHP-based tools simply stopped working.
Bitmap processing was particularly painful in PHP. I did all of the heat map generation in PHP, but I should have just written something that could run locally instead of on a web server. I ran into a number of bugs in the PHP GD interface (compositing bitmaps with alpha is pretty broken), and ended up having to reduce the size of my level art images in order to do the processing.
For this article, I rewrote this tool using Python and ImageMagick, and the results are far superior. I’ve provided the code for this implementation, which can be found at the official Game Developer magazine website.
Finally, though this data tells me all about where players die and how long it takes them to complete levels, it doesn’t help me identify shelf moments that are not related to death. I ended up shipping with a few key level design failures that my metrics never caught; in the most egregious case, players get stuck at a puzzle where they do not understand how to progress, and end up giving up before they complete the level.
This never shows up in my metrics because an event condition is never reached; I only learned about it when users started complaining about being stuck in the same spot. Automatic metrics are super-useful, but they can’t show you a complete view of the game. In my case, the metrics were good at finding problematic level layouts but were particularly ineffective at identifying design failures related to rule communication.
The Future
For my next game, I’ll definitely employ automatic metrics reporting again. In addition to death positions, I may add events based on different forms of death; it’d probably be useful to know how exactly a player died, not just where. And, depending on the game, it might be useful to report a history of positions before the death so that an individual player’s path through a level can be traced.
However, the key to this kind of system is simplicity; collecting data isn’t useful unless I also have reliable tools to process it later. For the next title, I’ll probably leave the basic reporting and storing mechanism alone and focus most of my time on writing better tools for crunching the numbers.
I’m also wondering whether aggregated output from this form of player metric can be used to inform runtime dynamic difficulty systems.
If the game were capable of reading aggregated output back from a server, it could change itself based not only on the play of a single player, but on the average habits of millions of players. The availability of this data opens up all sorts of interesting possibilities.
Player metrics are not a perfect replacement for user testing, but they are a pretty useful approximation. And because they allow you to test a much larger group of users than would be possible with individual testers, metrics can tell you more about your game in the long run.
The cost to benefit ratio was extremely positive for Replica Island; by keeping the runtime and server dead simple, I learned much about my level designs and the habits of my players, and my game got a lot better as a result. My only regret is that I did not employ this kind of system on earlier games — it seems applicable to pretty much any genre on pretty much any platform.(source:gamasutra)










 闽公网安备35020302001549号